Image Viewer
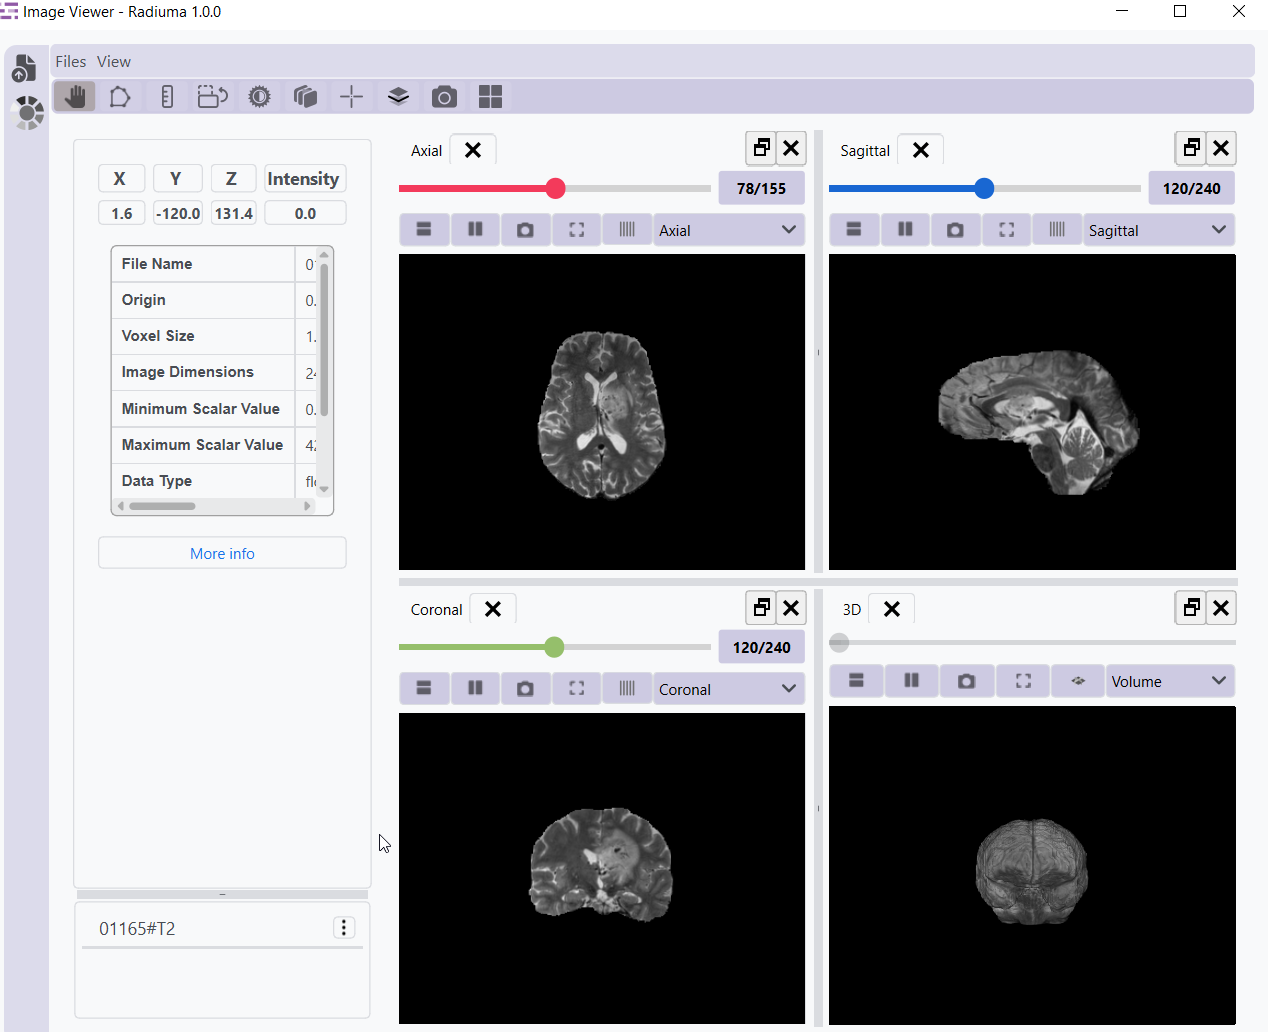
The Image Viewer module provides a sophisticated visualization interface within Radiuma for detailed examination, segmentation, and analysis of medical imaging data across multiple planes and dimensions. This comprehensive tool enables clinicians and researchers to navigate complex medical images through axial, sagittal, coronal, and 3D volumetric views while offering advanced functionality for image manipulation, measurement, and segmentation. With support for multiple file formats including DICOM studies, NIFTI files, and segmentation data, the viewer integrates essential tools for real-time coordinate tracking, intensity analysis, contrast adjustment, filtering and distance measurement—all within an intuitive interface that facilitates precise anatomical localization, treatment planning, and quantitative analysis for both clinical diagnostics and research applications.
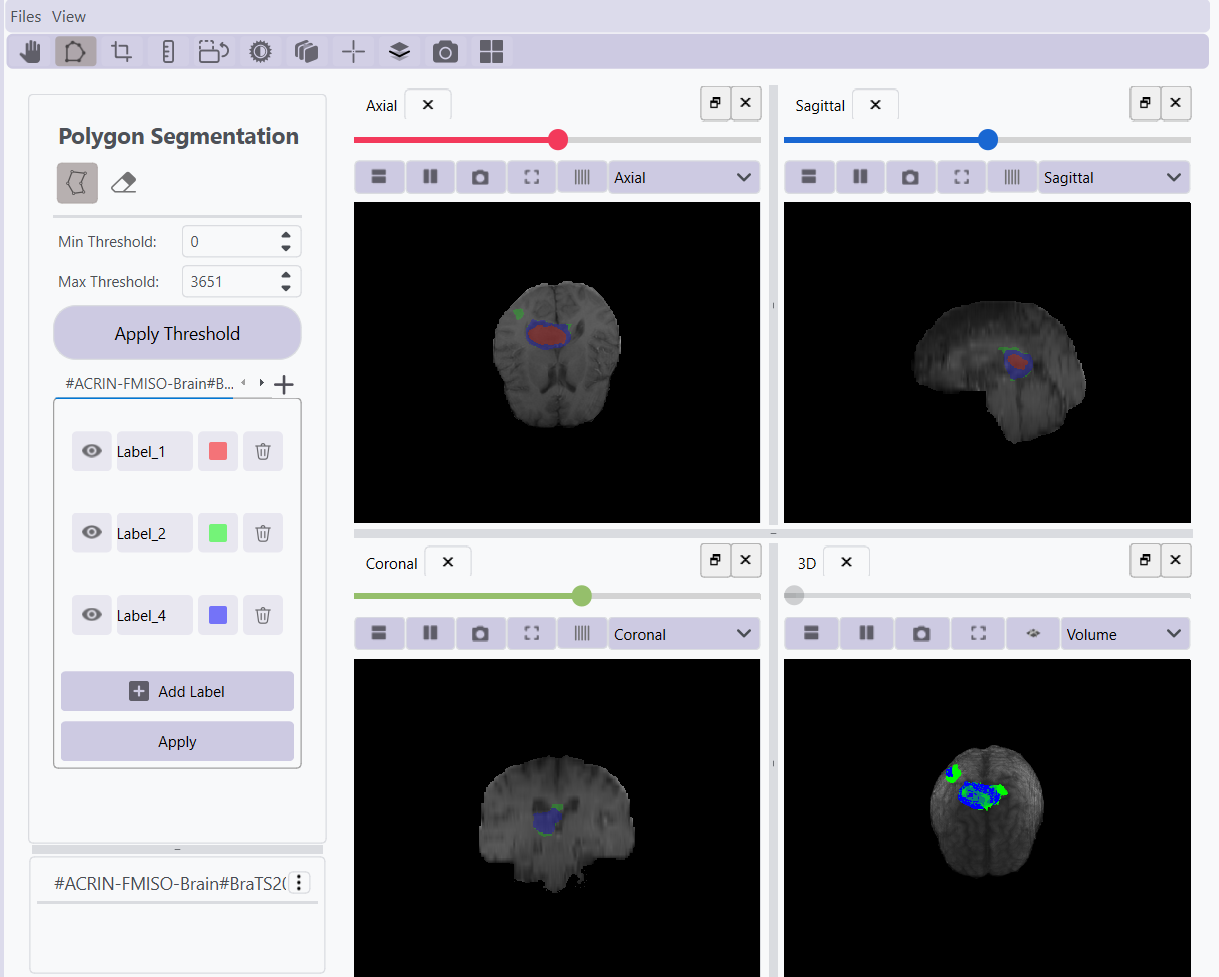
View Types
Axial View: Horizontal cross-sections (top-down view)
Sagittal View: Vertical cross-sections from side to side
Coronal View: Vertical cross-sections from front to back
3D View: Complete three-dimensional rendering with:
Volume View: Full 3D visualization of image data
Mask View: Visualization of segmentation results
File Support
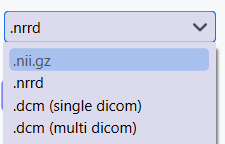
NIFTI Files: Support for Neuroimaging Informatics Technology Initiative format (Nifti)
DICOM Files: Individual Digital Imaging and Communications in Medicine (DICOM) image support
DICOM Directories: Support for complete DICOM studies/series
Segmentation Files: Import/export of segmentation data
RT Structure Files: Import RT structure files
Toolbar Functions

Image Navigation & Information
Hand Tool: Real-time coordinate display, intensity values, metadata access
Image List: Layer navigation with options for information, removal, and colormap customization
Image Manipulation Tools
Segmentation: Threshold-based and manual drawing tools
Ruler: Precise distance measurements
Rotation: Rotate images along any axis with animation capabilities
Contrast: Window/level adjustment and brightness controls
Filter: Apply threshold-based filters
Visualization Controls
Crosshairs: Toggle visibility, synchronized across all views
Overlay: Add image layers with transparency control
Screenshot: Capture and save current view
Layout Control: Reset to standard four-panel layout
Detailed Functionality
Pan Tool
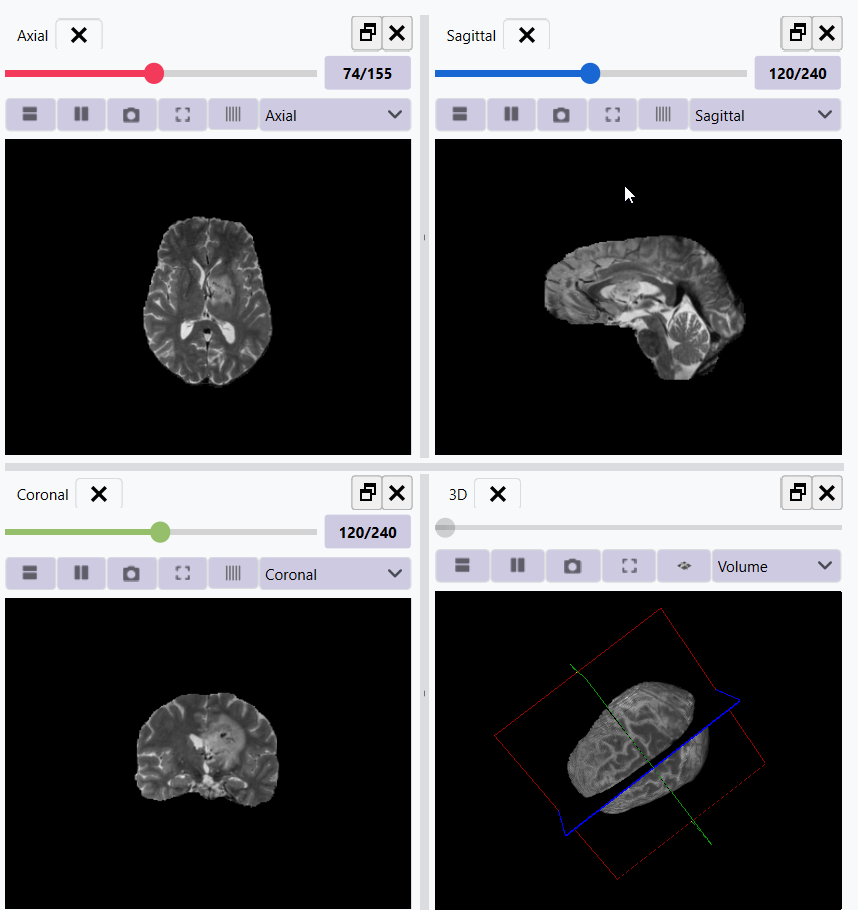
The Pan tool is a button in the 3D view that shows a plane of the current slice in 2D view. Clicking on each 2D view changes the focus to that view and displays the corresponding slice. Users can navigate through slices in each 2D view by dragging the slider located at the top of the view. This functionality is essential for examining specific areas of interest in large medical images.
Image Information
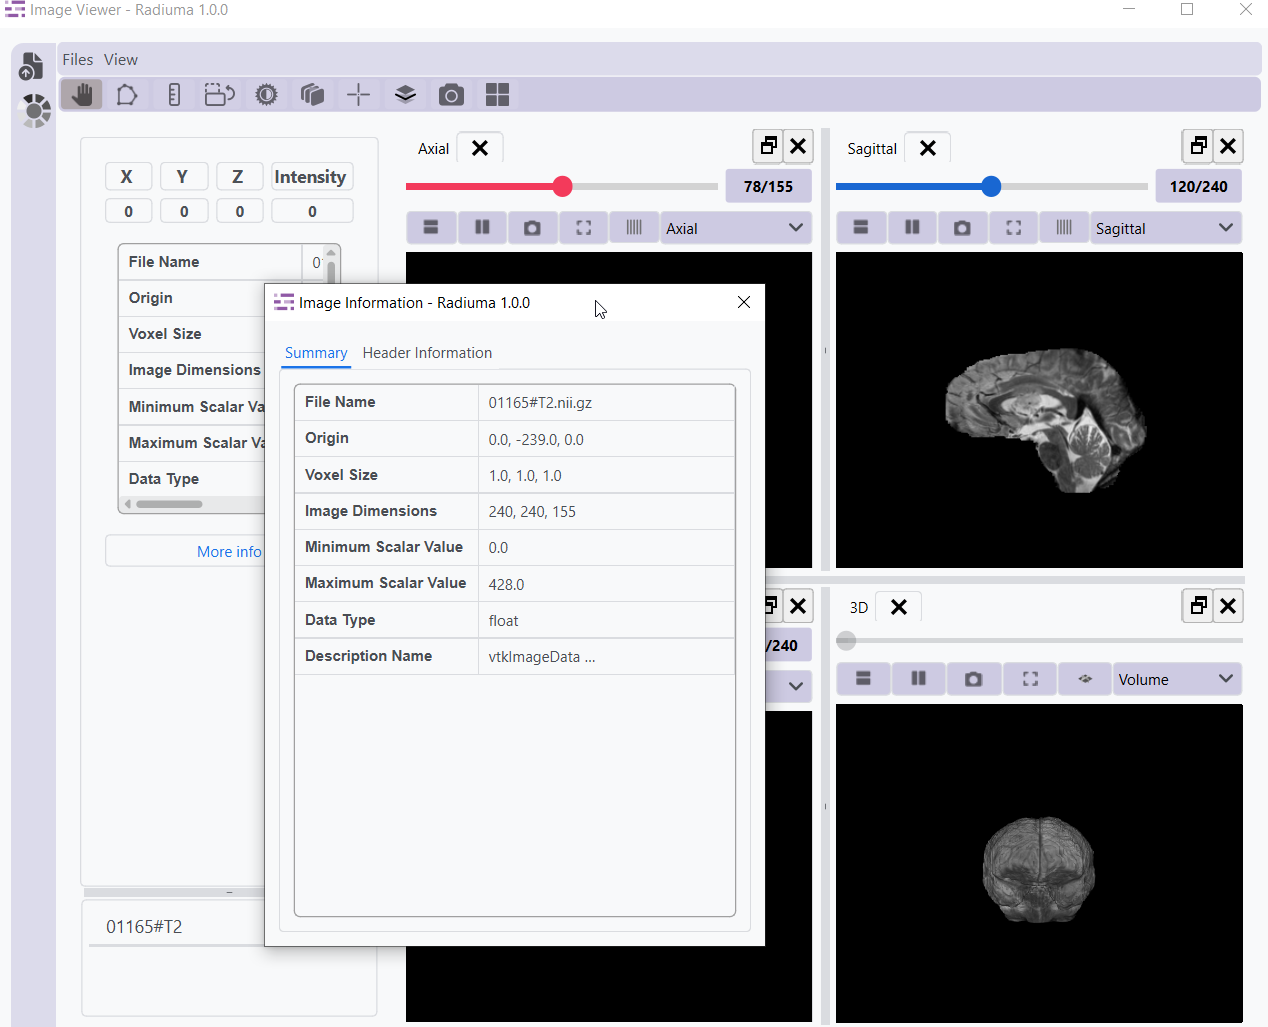
Access detailed information about the active image, including dimensions, spacing, origin coordinates, and voxel intensity statistics. This feature provides essential metadata for accurate image analysis. You can access the image information by clicking the 3 dots at the left side of the loaded image and selecting “Image Information”.
Colormap Adjustment
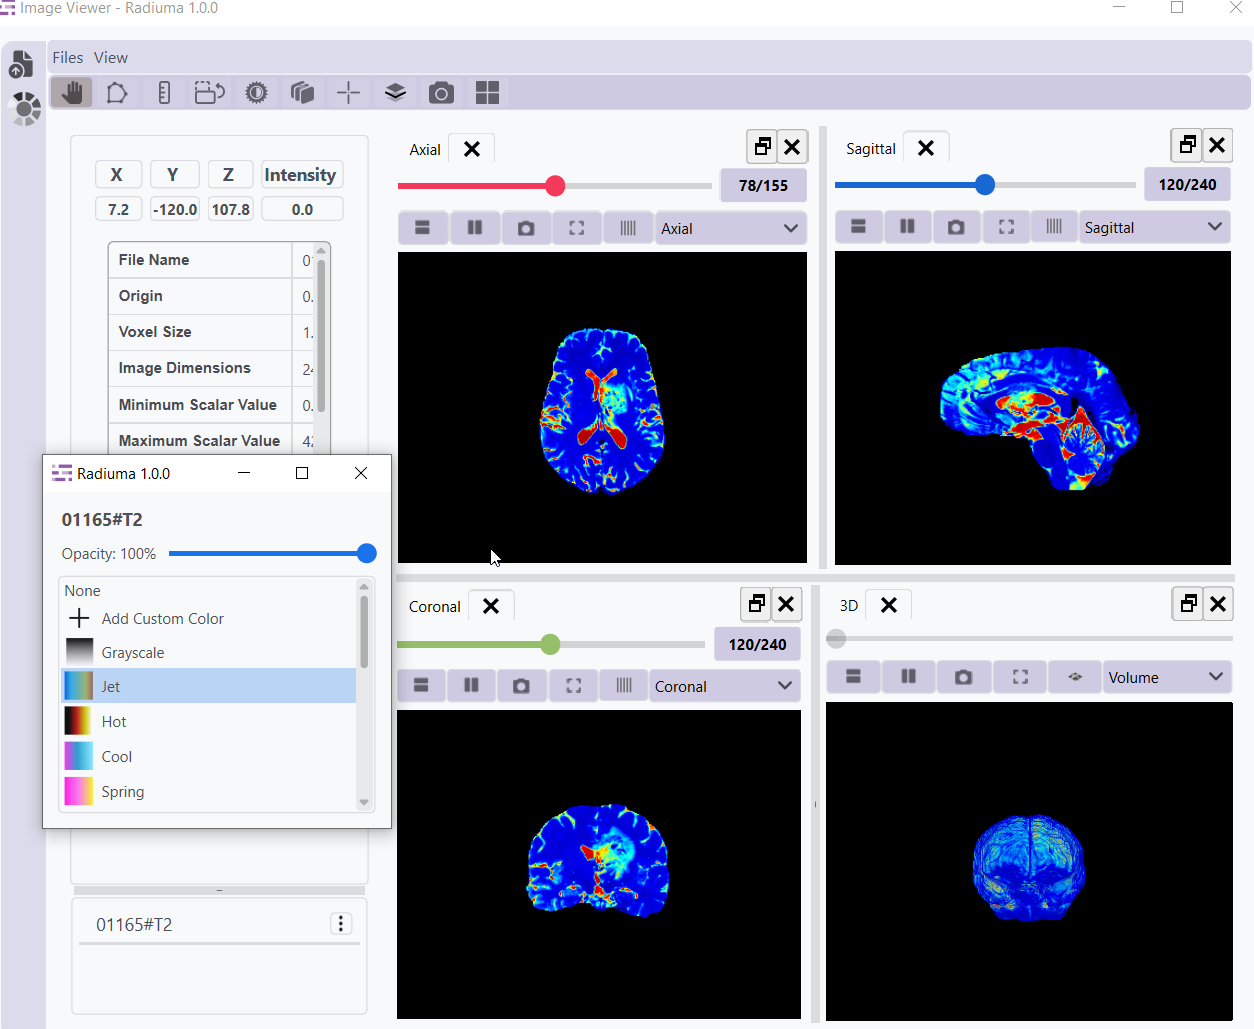
Customize the visualization of medical images by selecting from a variety of color schemes. Different colormaps can highlight specific tissue types or abnormalities, enhancing visual interpretation of complex medical data. Access the colormap panel by clicking the 3 dots beside the loaded image and selecting the colormap option.
Image Overlay
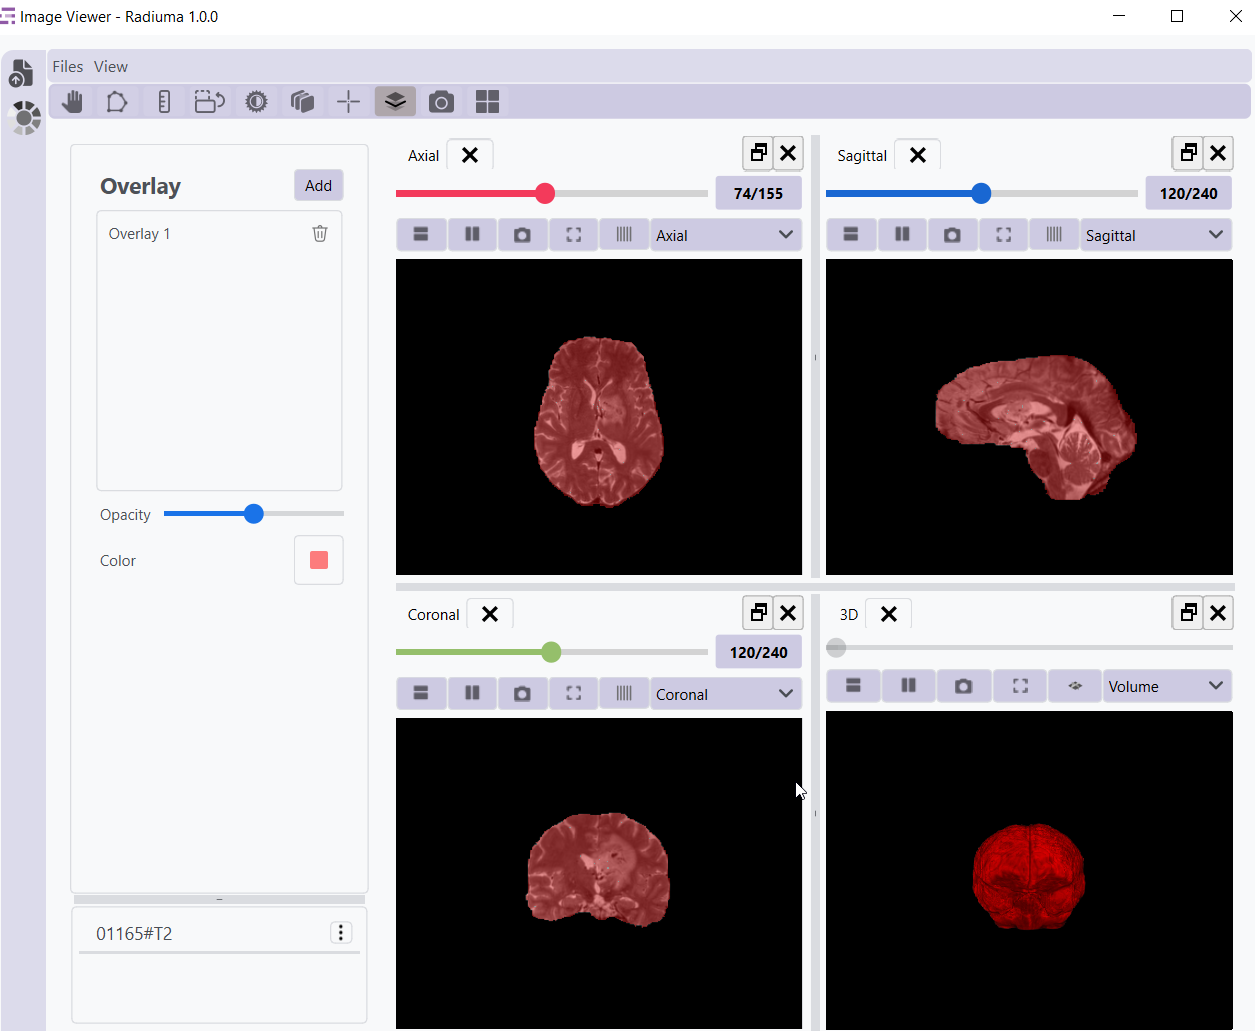
Combine multiple images using overlay techniques with adjustable transparency levels. This functionality is valuable for comparing different imaging modalities or pre/post-treatment images.
Breeding (Coming Soon)
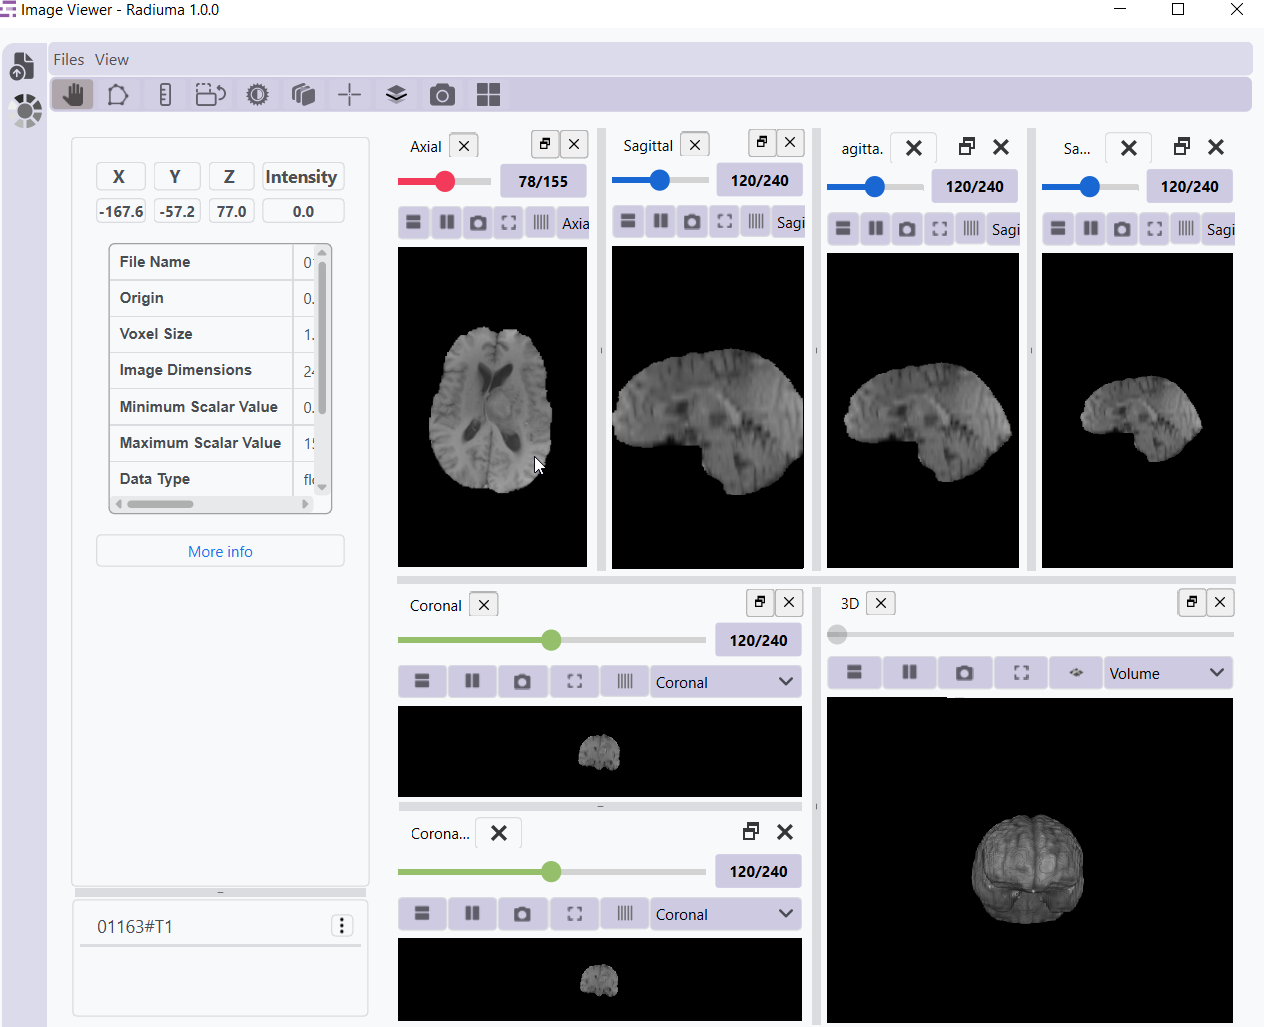
Add another view to the current view either horizontally or vertically. This feature allows for efficient side-by-side or stacked comparison of different image perspectives.
Crosshair Navigation
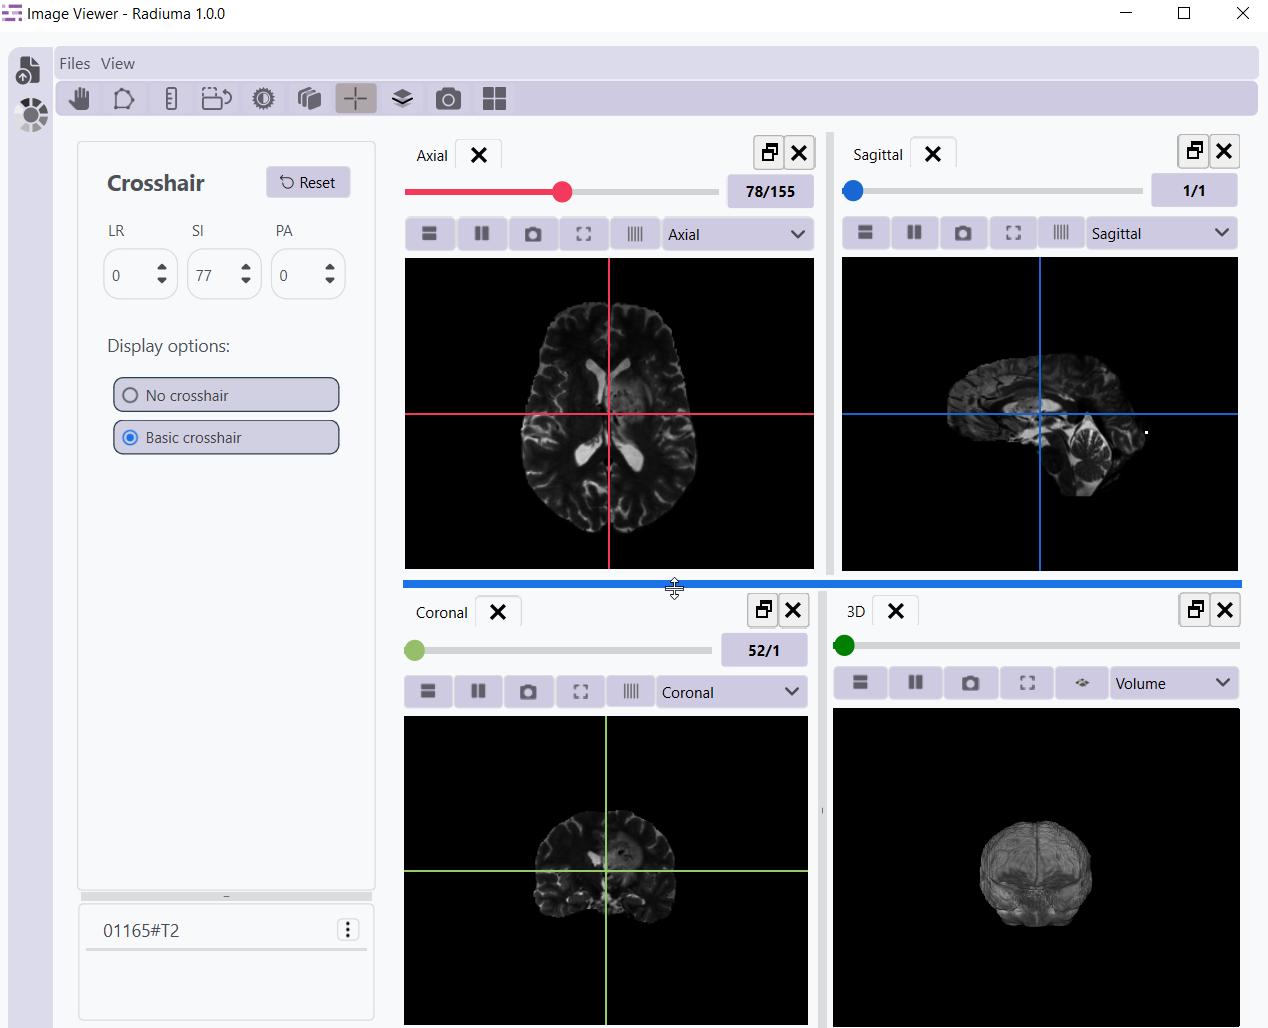
Enable synchronized crosshairs across all views for precise anatomical localization. Crosshairs help in identifying the same point across different orthogonal views (axial, sagittal, coronal).
Image Filtering
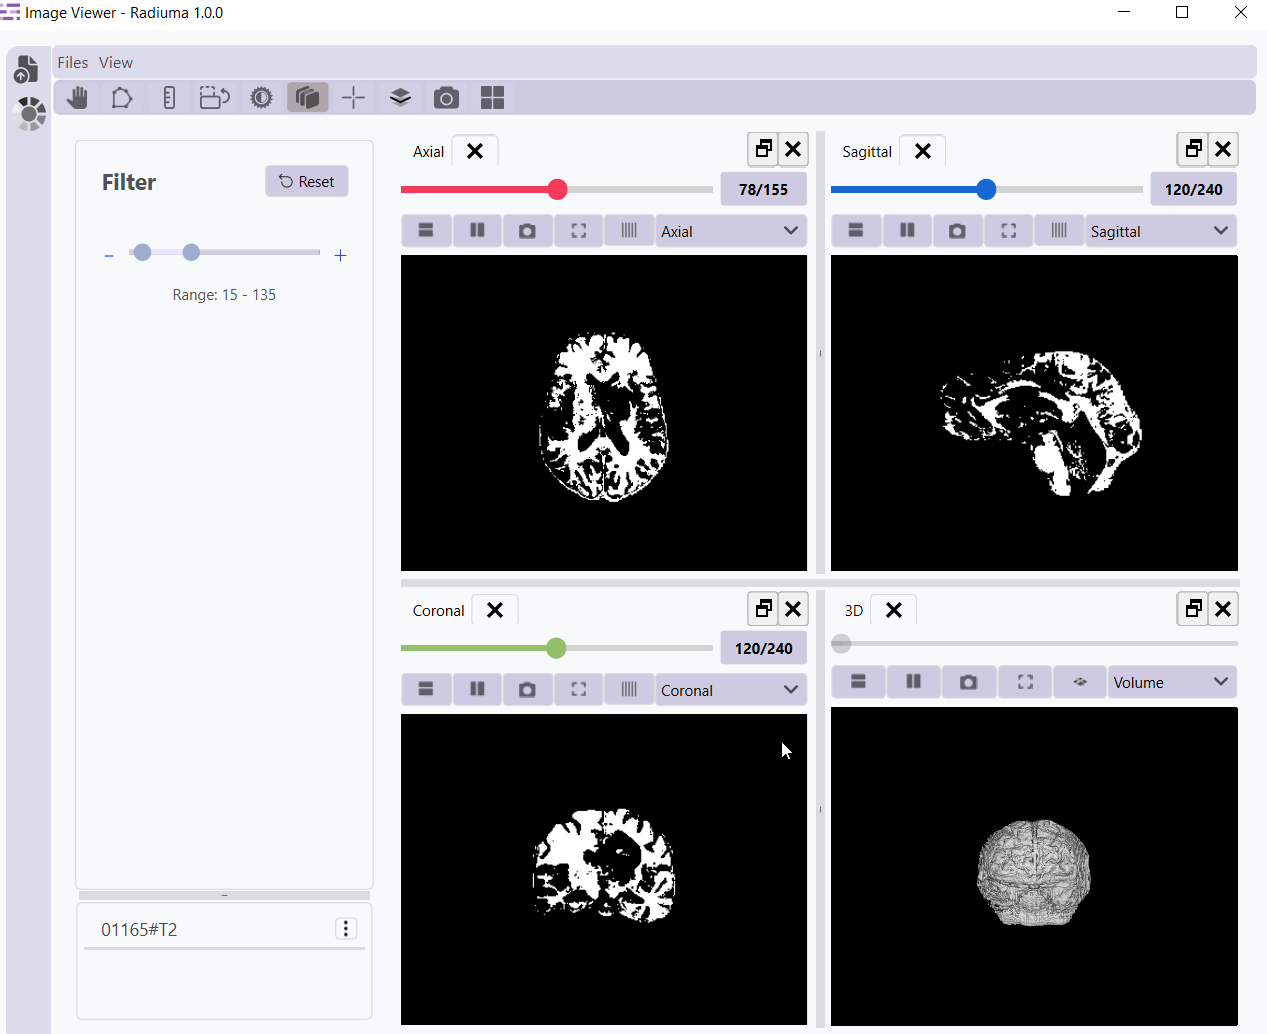
Apply image filter to enhance visualization or highlight specific features. Filters can be used to enhance edges, or apply thresholds based on intensity values.
Contrast Adjustment
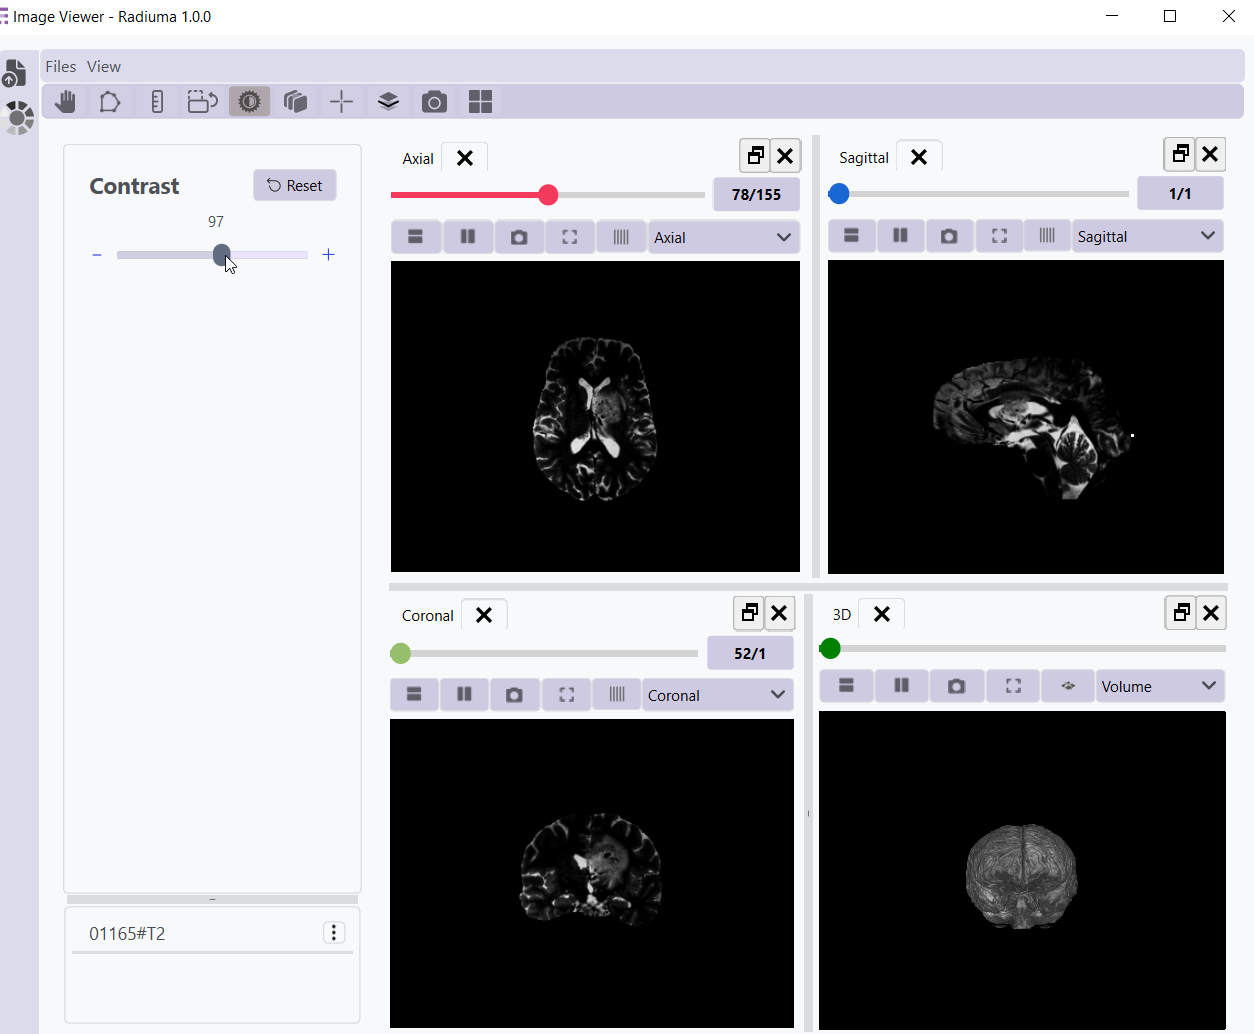
Fine-tune window/level settings to optimize image contrast for specific tissues or pathologies. This essential tool allows users to visualize structures with different density or intensity characteristics. By holding the left mouse button and moving the mouse up, down, left, or right, you can change the window and level of the image, thereby adjusting the contrast. Image Rotation “””””””””””””
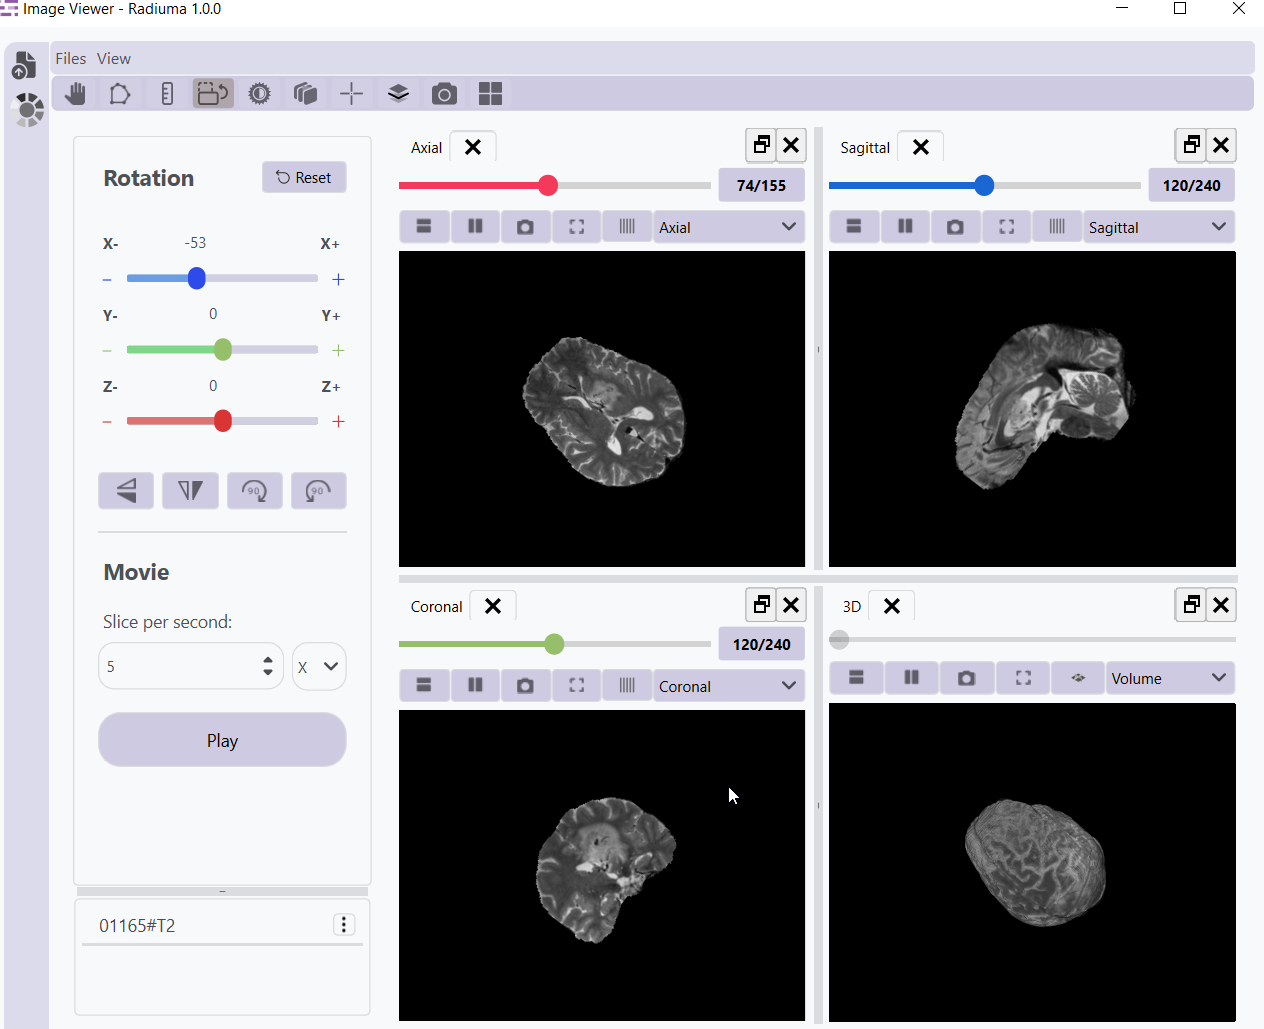
Rotate medical images along any axis with precise angle control. Rotation capabilities help in standardizing image orientation or examining structures from different perspectives.
Distance Measurement
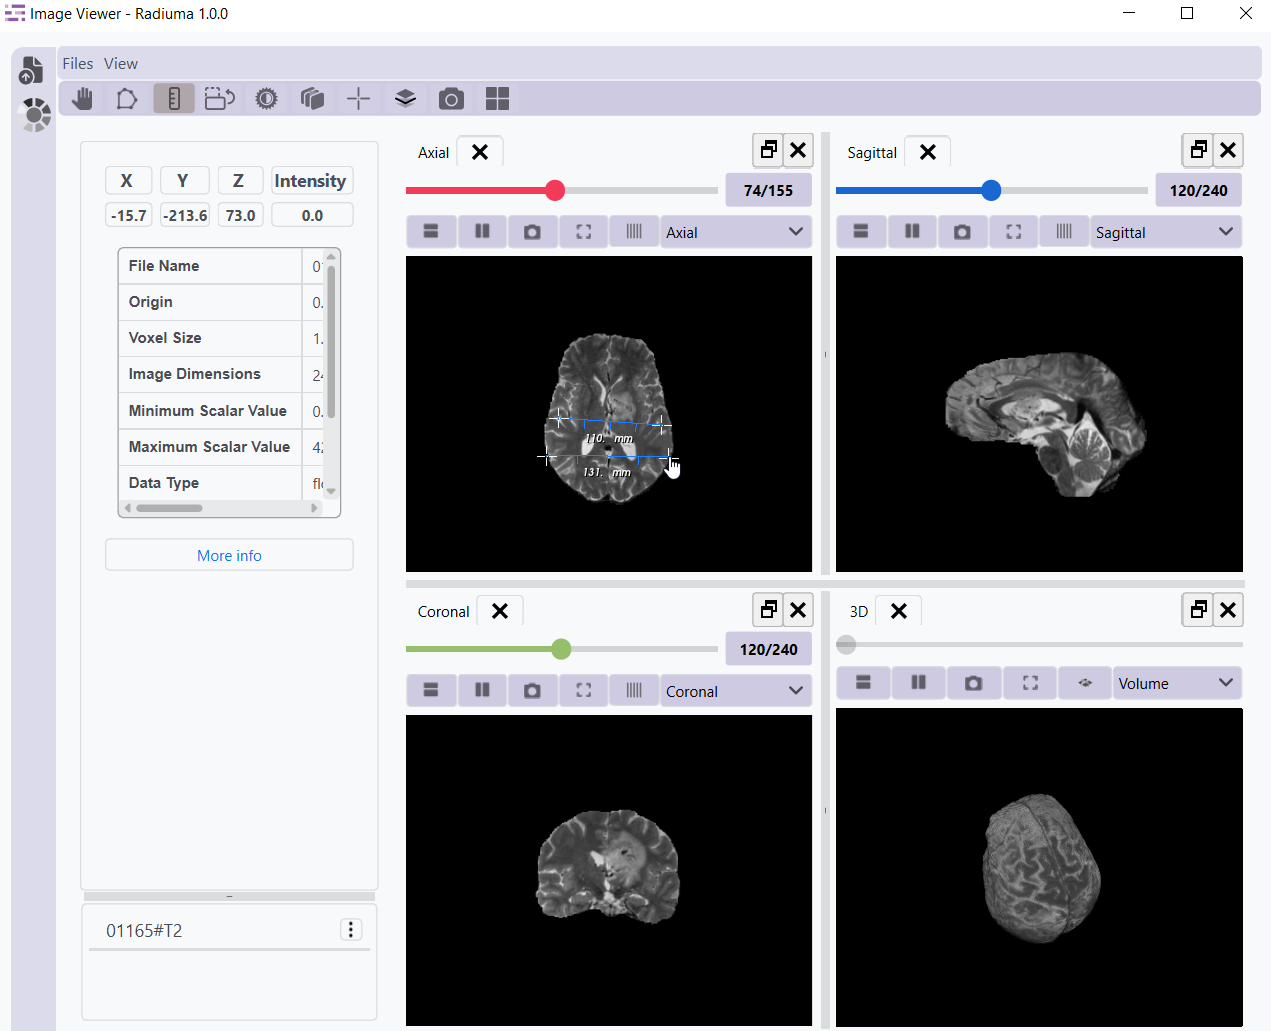
Measure precise distances between anatomical structures using the ruler tool. This functionality provides quantitative spatial information critical for diagnosis and treatment planning.
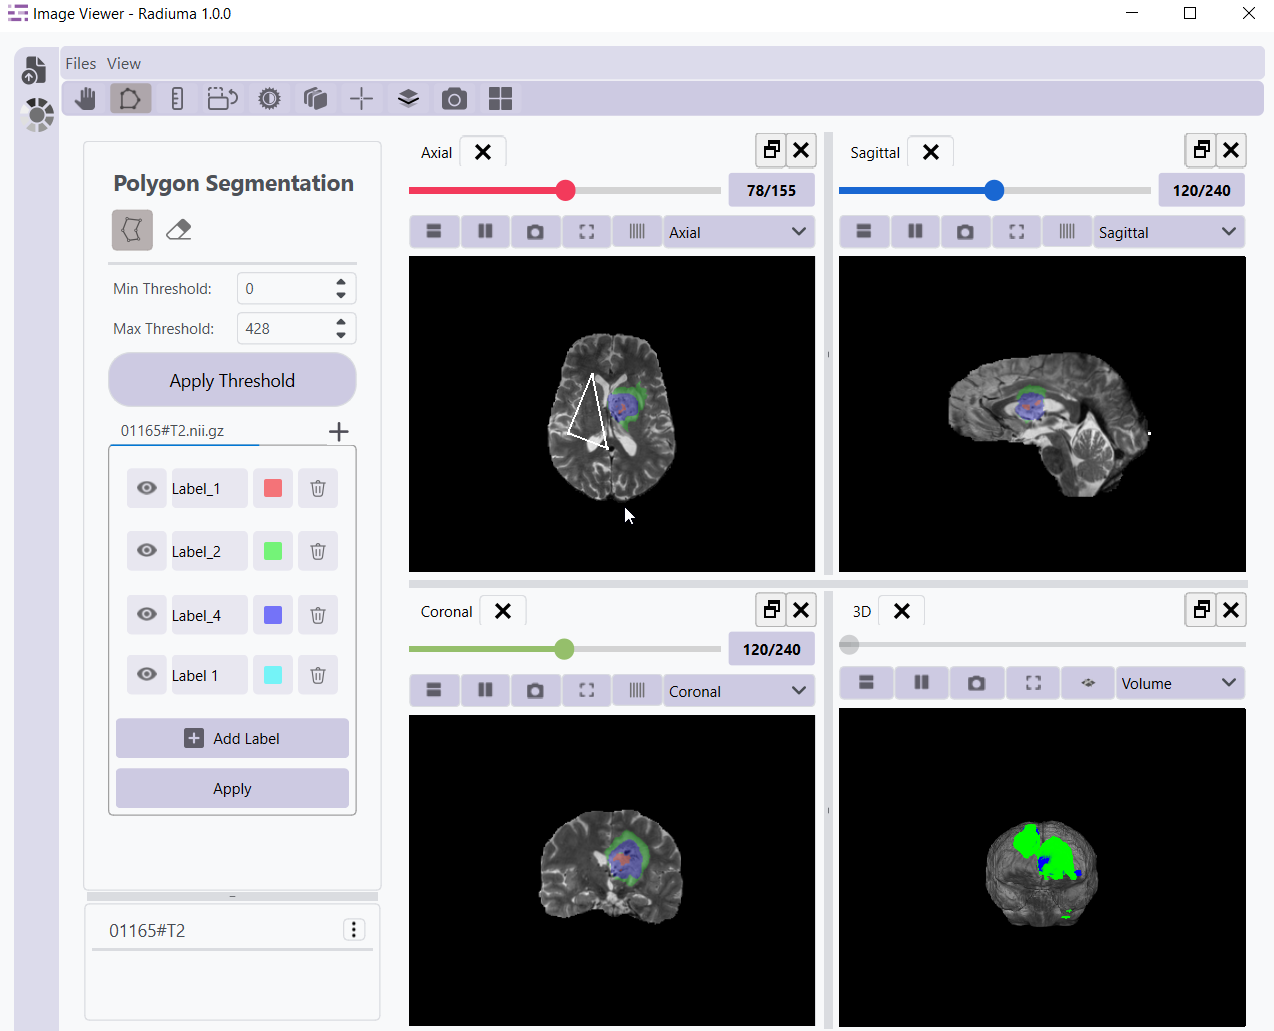
Segmentation Tools
Create anatomical or pathological segmentations using manual and semi-automated tools. The segmentation interface provides brush and drawing options for precise delineation of structures.
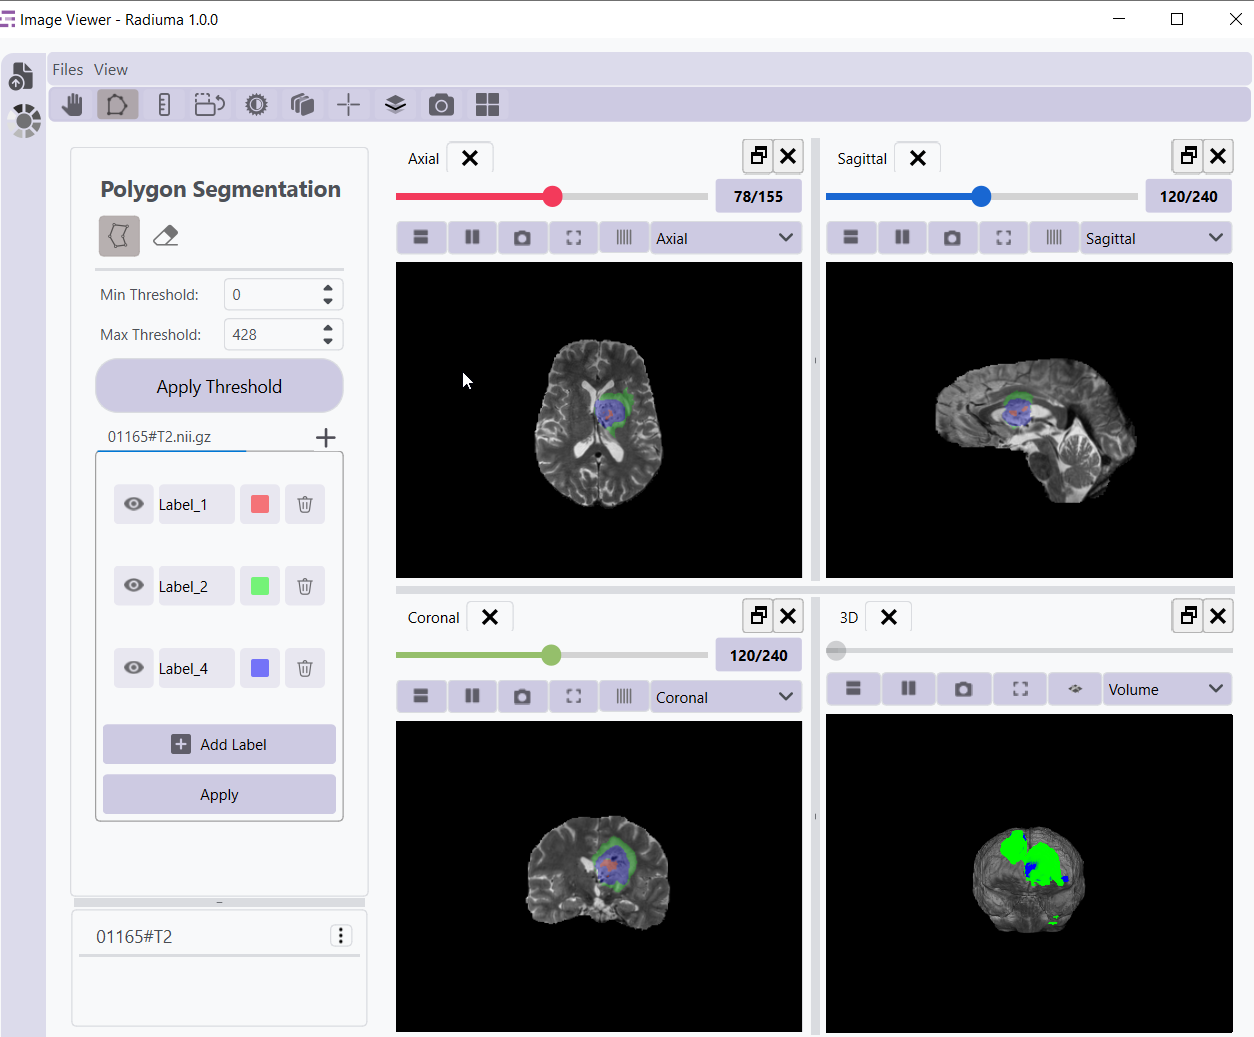
Add Label
The Add Label feature allows users to create new segmentation labels manually directly within the segmentation panel.
Click “Add Label” to generate a new label entry.
Assign a name and color to the label for clear differentiation then click “Apply”.
Once created, the new label can be selected and used for drawing or threshold-based segmentation.
This functionality supports multi-label segmentation workflows for complex anatomical or pathological structures, enabling efficient management and visualization of multiple ROIs.
Eraser Tool
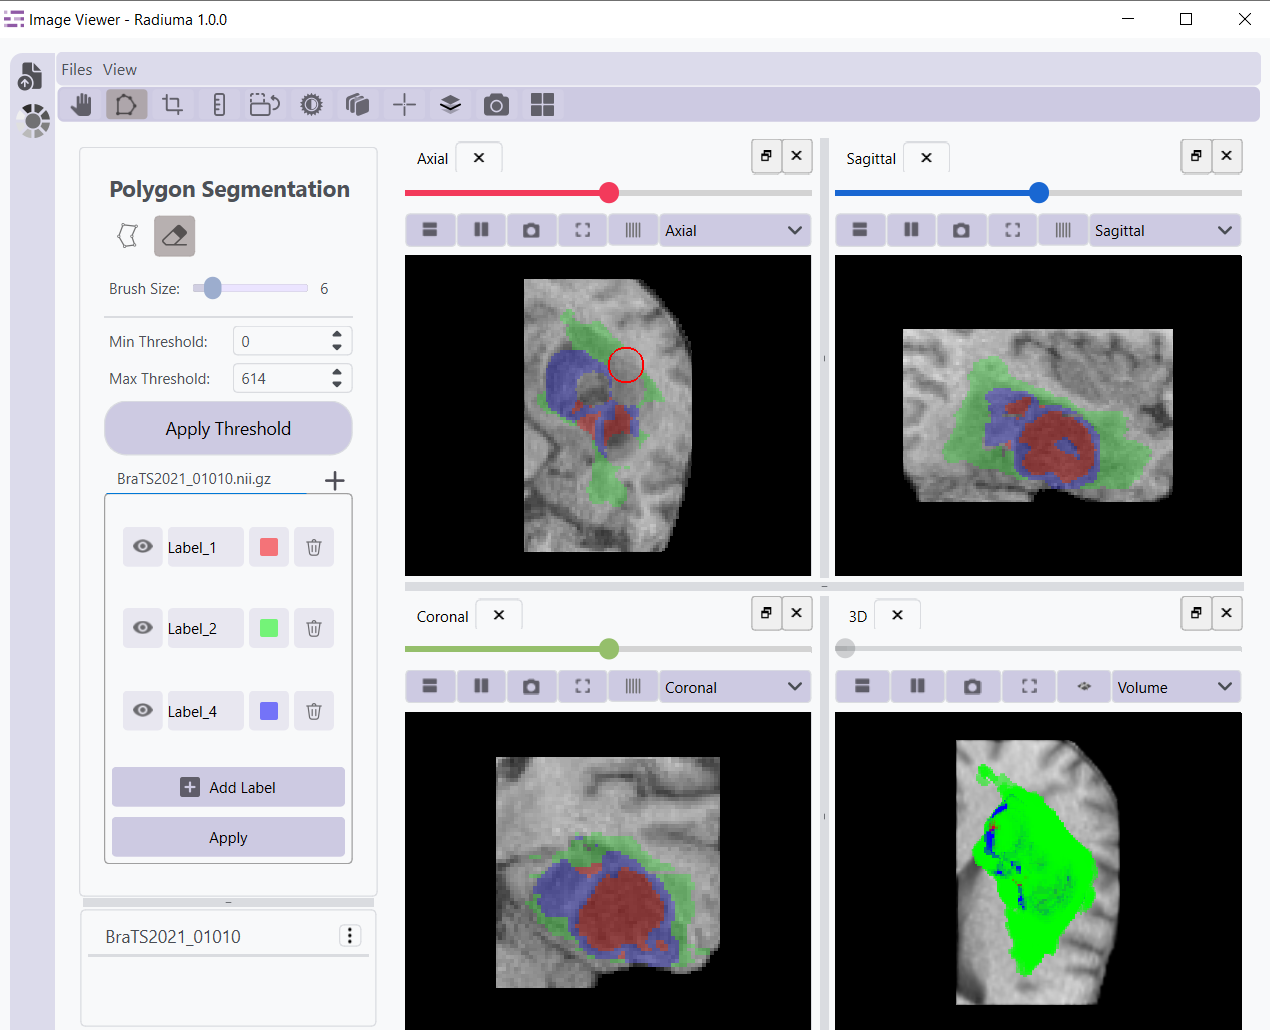
The Eraser Tool enables users to modify existing segmentations by removing unwanted regions from the current label or ROI.
Activate the eraser mode from the segmentation toolbar.
Adjust the brush size to control the precision of the erasing action.
The erased regions are dynamically updated in all orthogonal views (Axial, Sagittal, and Coronal).
This tool provides flexible post-editing capabilities to refine segmentation boundaries without restarting the segmentation process.
Volume Mask Toggle
Toggle in the 3D view that switches between volume mode and mask mode. Volume mode displays both the image and segmentations together, while mask mode shows only the segmentations, allowing for clearer visualization of the segmented structures.
Video Tutorial: Watch the step-by-step guide on YouTube: Image Viewer | Medical Image Visualization with Radiuma | Radiuma Tutorial