Examples
This section provides step-by-step guides for common tasks in Radiuma to help users get started quickly.
Image Conversion
The Image Conversion functionality allows users to easily convert medical images between different file formats, making it simple to work with various imaging systems and software.
How It Works
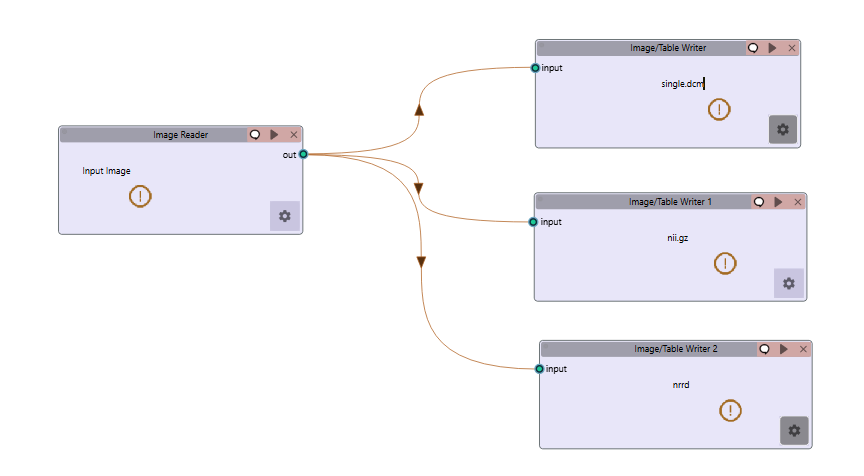
Image Reader Tool: First, use the Image Reader to load your source images
Supports reading from individual files or entire folders
Compatible with NIFTI (.nii, .nii.gz), NRRD, and DICOM formats
Handles both single images and multi-file image series
Writer Tool: Then, connect the Writer tool to convert and save the images
Specify your desired output location
Choose the target format for conversion
Process individual files or batch convert entire directories
Workflow Integration
To convert images:
Example Workflow: Download the Image Conversion workflow
Sample Data: Use this multi-DICOM CT dataset as a multi-DICOM series to convert into other formats.
Add an Image Reader tool to your workflow
Configure the Image Reader to load your source image(s)
Add a Writer tool to your workflow
Connect the output port of the Image Reader to the input port of the Writer
Configure the Writer with your desired output format and location
Run the workflow to perform the conversion
This simple two-step process allows for easy conversion of medical images between supported formats without specialized knowledge of file formats or conversion tools.
Video Tutorial: Watch the step-by-step guide on YouTube: Image Conversion for Medical Images | Radiuma Tutorial
RT Struct Processing
RT Structure Sets are critical for radiation therapy planning and analysis. Radiuma provides a straightforward workflow for importing and processing these specialized files.
How It Works
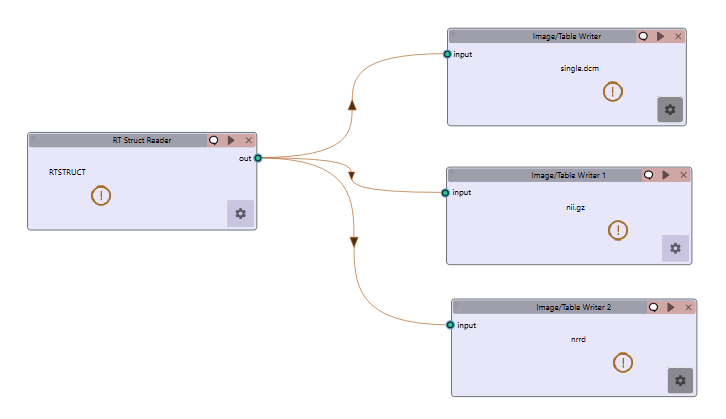
RT Struct Reader Tool: Begin by loading your radiation therapy structure set
Requires both a main image and corresponding structure set labels
The name of RTSTRUCT single dicom file must exactly match the name of the corresponding image folder.
RT Label Directory: Path to the RT structure set file
RT Main Image Directory: Path to the corresponding image data
Automatically extracts contours and segmentation information
Writer Tool: Connect to the Writer tool to save processed RT structures
Choose your desired output location
Select appropriate format for saving segmentation data
Preserve the relationship between images and their associated structures
Workflow Integration
To process RT Struct files:
Example Workflow: Download the RTSTRUCT Reader workflow
Sample Data: Use this RT-STRUCT dataset - Use the CT folder as the main image - Use the RT-Dicom folder as the Label image
Add an RT Struct Reader tool to your workflow
Configure the RT Struct Reader with paths to both your main image and structure set labels
Add a Writer tool to your workflow
Connect the output port of the RT Struct Reader to the input port of the Writer
Configure the Writer with your desired output location and format
Run the workflow to complete the processing
This workflow enables efficient handling of radiation therapy planning data while maintaining the integrity of structure sets and their associated imaging.
Image Filtering
Image filtering is essential for enhancing specific features, reducing noise, and preparing images for analysis. Radiuma provides several standardized filters that comply with IBSI guidelines.
How It Works
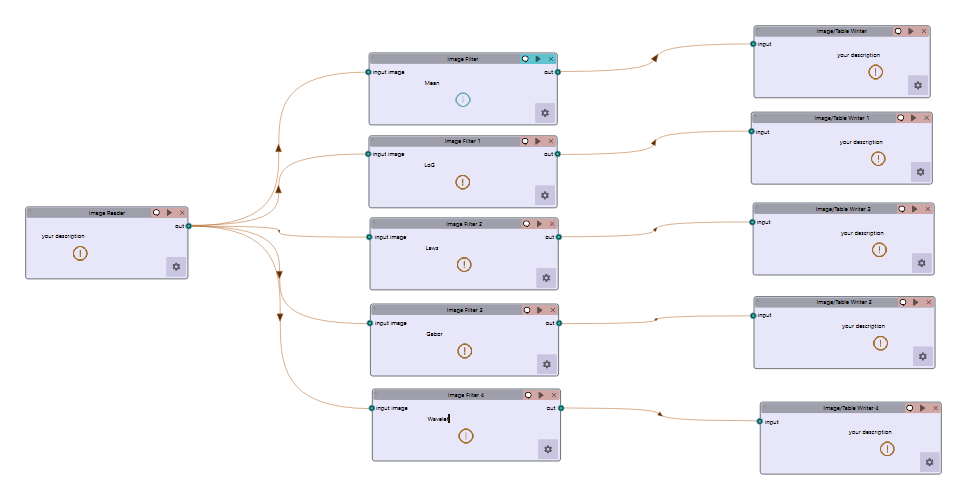
Image Reader Tool: Start by loading the medical image you want to filter
Select your source image file or directory
The tool supports NIFTI, NRRD, and DICOM formats
Filter Tool: Apply one or more filters to the input image
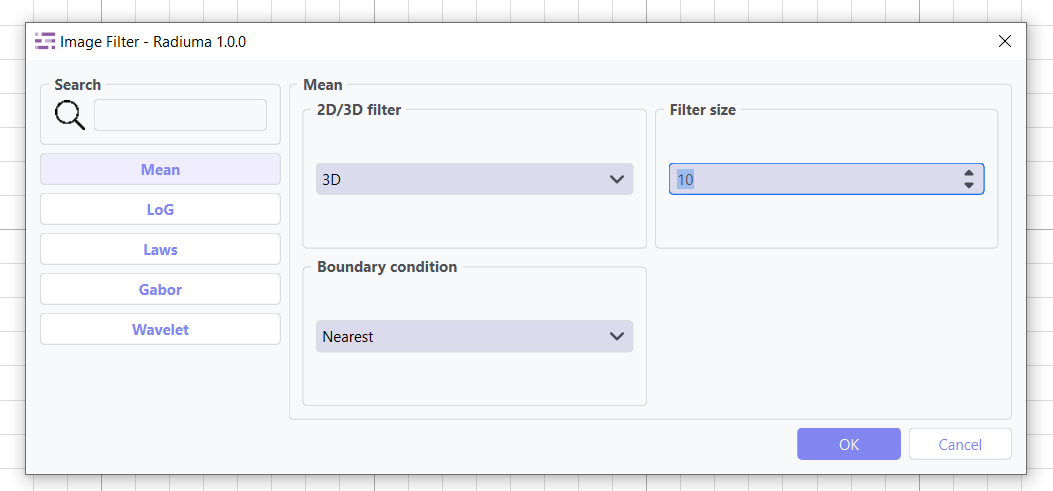
Mean Filter: Smooths images by replacing each pixel with the average of its neighborhood
LoG (Laplacian of Gaussian): Highlights edges and regions of rapid intensity change
Laws Filter: Extracts texture features using small convolution kernels
Gabor Filter: Identifies texture and directional features at various scales
Wavelet Filter: Performs multi-resolution analysis for feature extraction
Writer Tool: Save the filtered image to your desired location
Select output location and format
Preserve metadata from the original image
Customizable Parameters
Each filter provides adjustable parameters to fine-tune the results:
Mean Filter: Kernel size, boundary handling
LoG Filter: Sigma value, kernel size
Laws Filter: Kernel type, window size
Gabor Filter: Frequency, orientation, bandwidth
Wavelet Filter: Wavelet family, decomposition level, boundary handling
Workflow Integration
To filter medical images:
Example Workflow: Download the Image Filtering workflow
Sample Data: Use images from different modalities in the Data folder as input for the filtering module (MRI, CT, PET)
Add an Image Reader tool to your workflow
Configure the Image Reader to load your source image
Add a Filter tool to your workflow
Connect the output port of the Image Reader to the input port of the Filter
Select the desired filter type and adjust parameters
Add a Writer tool to your workflow
Connect the output port of the Filter to the input port of the Writer
Configure the Writer with your desired output location and format
Run the workflow to apply the filter and save the results
For example, we can apply a Mean filter to the image to smooth the image. We set params to this:
The image before filtering is:
The image after filtering is:
This workflow enables precise control over image enhancement techniques while maintaining compatibility with downstream analysis tools.
Video Tutorial: Watch the step-by-step guide on YouTube: Image Filtering for Medical Images | Radiuma Tutorial
Image Fusion
Image fusion combines information from multiple images into a single composite image, preserving the most important visual information from each source. This is particularly useful for integrating complementary data from different imaging modalities or acquisition times.
How It Works
Image Reader Tool: Load the images you want to fuse
You’ll need two separate Image Reader tools, one for each input image
Both images should have compatible dimensions for proper fusion
important:
Each fusion method contains a Normalization tab that must be configured before processing. Proper normalization ensures correct fusion results by matching intensity ranges between images.
Before applying any fusion method, normalization is required to ensure proper scaling and comparable intensity ranges between input images.
Key Parameters
Normalization Method:
MinMax: Scales data to a specified range (default: [0, 1])
ZScore: Standardizes data to have zero mean and unit variance
Image Fusion Tool: Combine the images using one of three fusion methods
Weighted Fusion: Linear combination of input images * Weight 1: Contribution of first image (0-1) * Weight 2: Contribution of second image (0-1) * Interpolation: Method for combining images (Linear, Cubic, etc.)
Wavelet Fusion: Multi-resolution decomposition and fusion * Fusion Method: Algorithm for combining wavelet coefficients (Max, Min, Mean) * Level: Decomposition level for wavelet transform * Mode: Signal extrapolation mode * Wavelet: Wavelet family to use (Haar, etc.)
PCA Fusion: Principal Component Analysis based fusion * Number of Components: Components to use in reconstruction * SVD Solver: Algorithm for Singular Value Decomposition * Components: Number of principal components
Writer Tool: Save the fused image to your desired location
Select output location and format
Preserve metadata from the original images
Workflow Integration
To fuse medical images:
Example Workflow: Download the Image Fusion workflow
Sample Data: Use CT and PET images from the Data folder as input for fusion
Add two Image Reader tools to your workflow
Configure each Image Reader to load one of your source images
Add an Image Fusion tool to your workflow
Connect the output ports of both Image Readers to the input ports of the Image Fusion tool
Select the desired fusion method and adjust its parameters
Add a Writer tool to your workflow
Connect the output port of the Image Fusion tool to the input port of the Writer
Configure the Writer with your desired output location and format
Run the workflow to perform the fusion and save the results
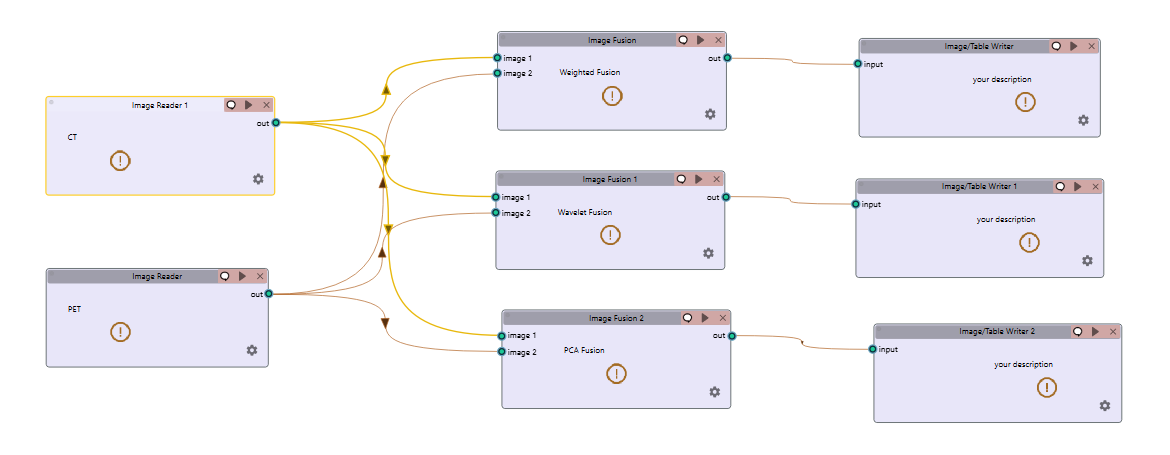
This workflow allows you to combine complementary information from different imaging sources into a single comprehensive visualization for improved analysis and interpretation.
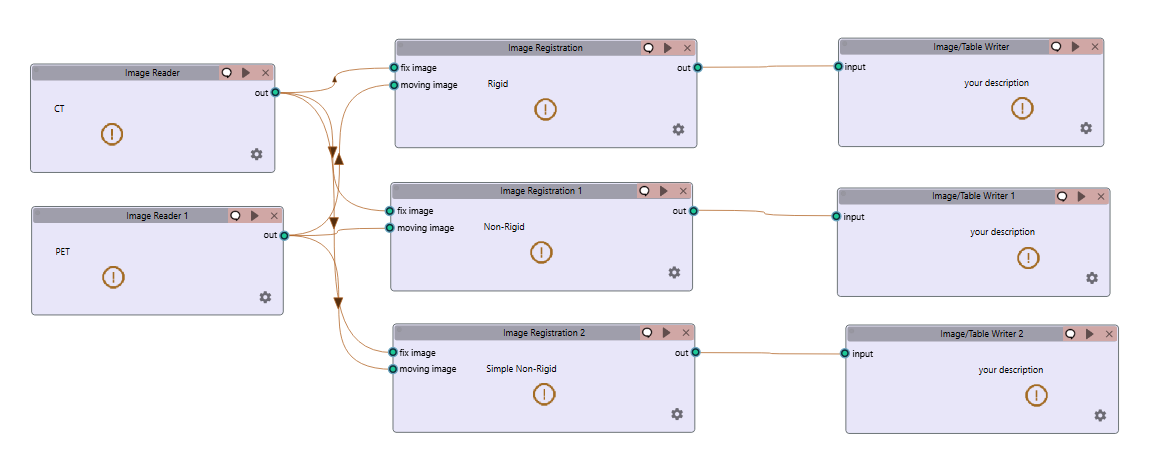
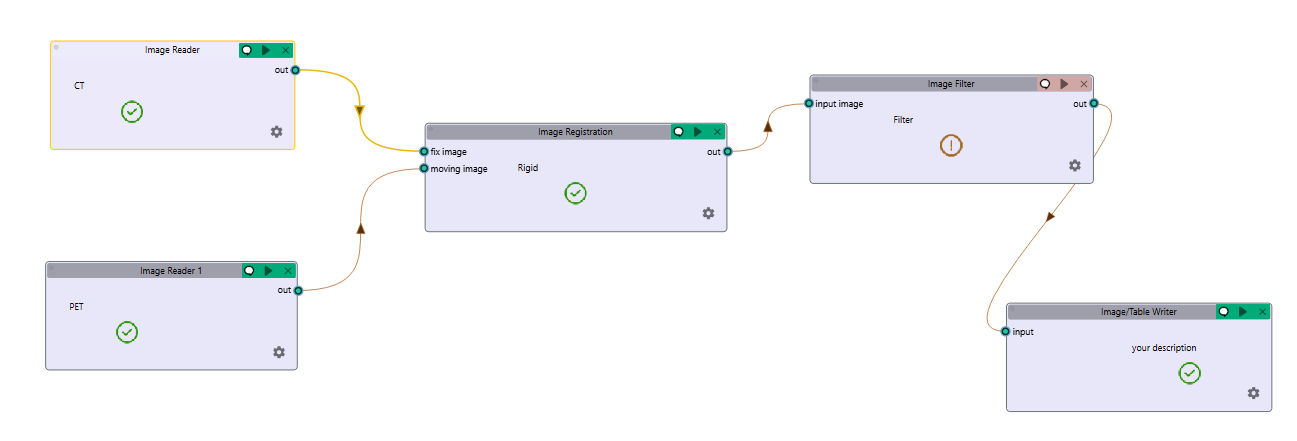
Image Registration for AutoPET
Image registration is a crucial step in medical image analysis, especially for multimodal imaging like PET/CT. This example demonstrates how to register PET and CT images from AutoPET datasets.
How It Works
Image Reader Tool (Fixed Image): Load the CT image as the fixed (reference) image
Configure the reader to point to your CT data source
CT scans typically provide detailed anatomical information
Image Reader Tool (Moving Image): Load the PET image as the moving image to be aligned
Configure the reader to point to your PET data source
PET scans provide functional or metabolic information
Image Registration Tool: Align the PET (moving) image to the CT (fixed) image
Rigid Registration: Maintains shape and size, only allows rotation and translation * Number of Histogram Bins: Controls the granularity of intensity matching * Sampling Method: Determines how points are sampled during registration * Learning Rate: Controls the optimization step size * Number of Iterations: Sets the maximum number of optimization steps * Interpolation: Method used for interpolating between voxels
Non-Rigid Registration: Allows local deformations for better alignment of soft tissues * Transform Type: Typically BSplineTransform for PET/CT registration * Number of Iterations: Controls the optimization process * Final Grid Spacing: Determines the density of the deformation field
Writer Tool: Save the registered PET image
Select output location and format
The registered image will be aligned to the anatomical reference of the CT image
Workflow Integration
To register AutoPET images:
Example Workflow: Download the Image Registration workflow
Sample Data: Use PET and CT images from the Data folder
Add an Image Reader tool for the fixed (CT) image
Configure the first Image Reader to load your CT image
Add a second Image Reader tool for the moving (PET) image
Configure the second Image Reader to load your PET image
Add an Image Registration tool to your workflow
Connect the output port of the CT Image Reader to the “fix image” input port of the Image Registration tool
Connect the output port of the PET Image Reader to the “moving image” input port of the Image Registration tool
Select the appropriate registration type and parameters based on your data
Add a Writer tool to your workflow
Connect the output port of the Image Registration tool to the input port of the Writer
Configure the Writer with your desired output location and format
Run the workflow to perform the registration and save the results
This registration workflow enables accurate spatial alignment of functional PET data with anatomical CT data, which is essential for proper localization and quantification of metabolic activity in cancer studies.
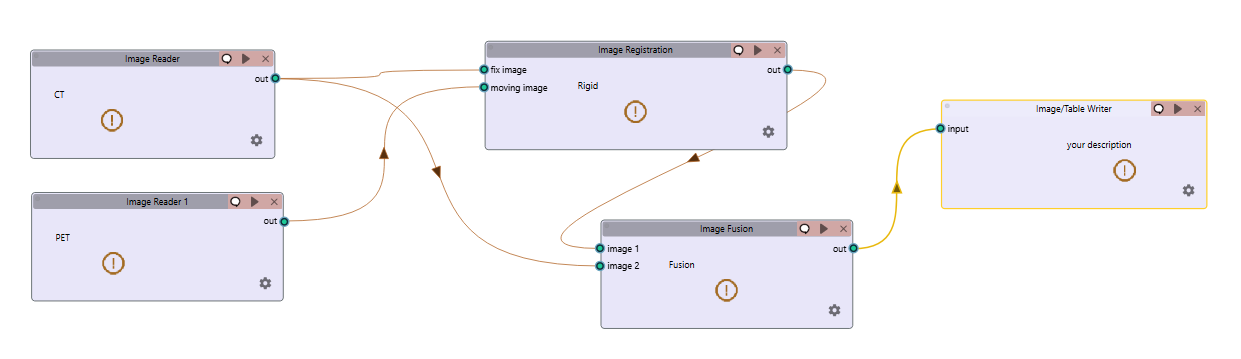
PET/CT Registration and Fusion
This advanced workflow combines both registration and fusion techniques to create comprehensive visualizations from multimodal AutoPET data. The workflow aligns PET images to CT images and then fuses them to combine functional and anatomical information.
How It Works
Image Reader Tool (CT): Load the CT image which serves dual purposes:
Acts as the fixed (reference) image for registration
Provides anatomical information for the fusion process (Image 2)
Image Reader Tool (PET): Load the PET image as the moving image to be aligned
The PET data contains functional/metabolic information
Will be spatially registered to match the CT reference frame
Image Registration Tool: Align the PET image to the CT reference
Uses either rigid or non-rigid registration depending on requirements
Produces a spatially aligned PET image that matches the CT coordinate system
Image Fusion Tool: Combine the registered PET with the original CT
Input 1: Registered PET image (from registration tool)
Input 2: Original CT image (directly from CT Image Reader)
Creates a single composite image highlighting both structure and function
Writer Tool: Save the fused image for further analysis
Preserves both anatomical context and metabolic information
Can be saved in various formats for use in clinical or research contexts
Workflow Integration
To implement this PET/CT registration and fusion pipeline:
Example Workflow: Download the PET/CT Registration & Fusion workflow
Sample Data: Use CT and PET images from the Data folder
Add two Image Reader tools to your workflow: * One for the CT image * One for the PET image
Configure both Image Readers to load the appropriate data
Add an Image Registration tool and connect: * CT Image Reader output → “fix image” input * PET Image Reader output → “moving image” input
Configure registration parameters appropriate for PET/CT alignment: * For most applications, rigid registration with appropriate histogram bins * For soft tissue focus, consider non-rigid registration
Add an Image Fusion tool and connect: * Registration tool output → “Image 1” input * CT Image Reader output → “Image 2” input
Configure fusion parameters: * For clinical viewing, weighted fusion with customized color maps * For feature analysis, consider PCA or wavelet fusion
Add a Writer tool and connect: * Fusion tool output → Writer input
Configure the Writer with your desired output location and format
Run the workflow to register, fuse, and save the results
This integrated workflow creates comprehensive visualizations that preserve the metabolic sensitivity of PET while maintaining the anatomical detail of CT, which is particularly valuable for tumor localization, treatment planning, and response assessment in oncology applications.
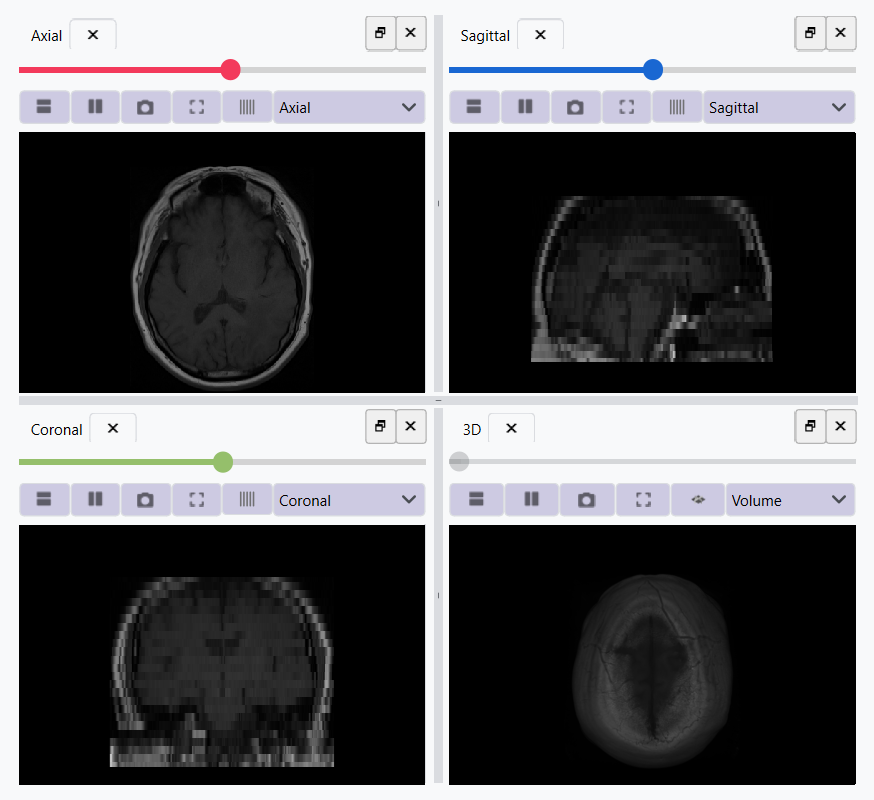
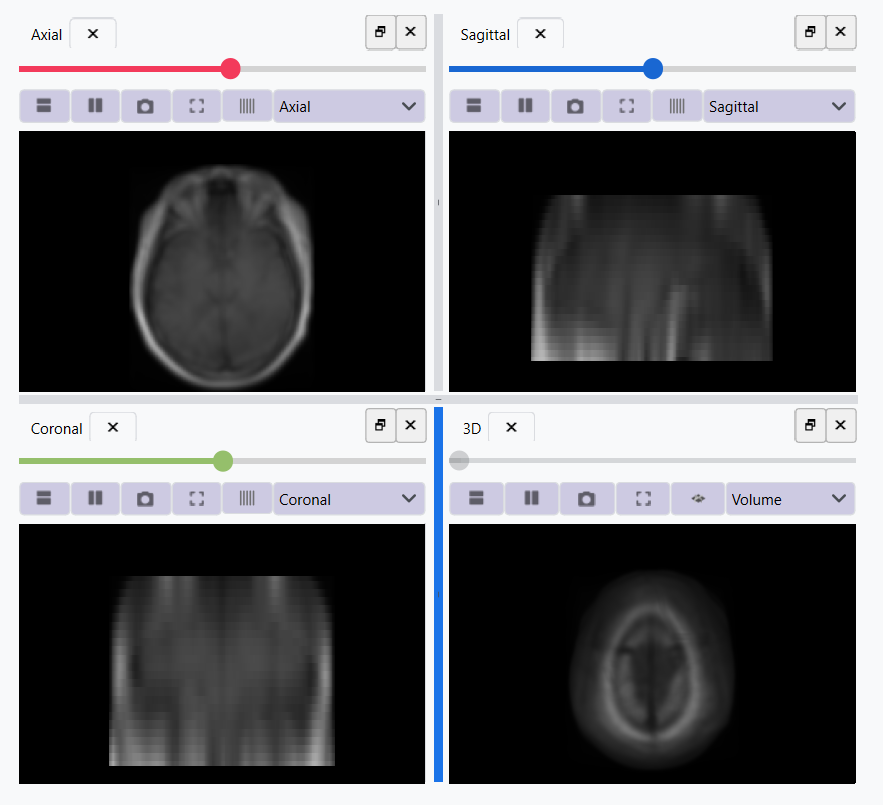
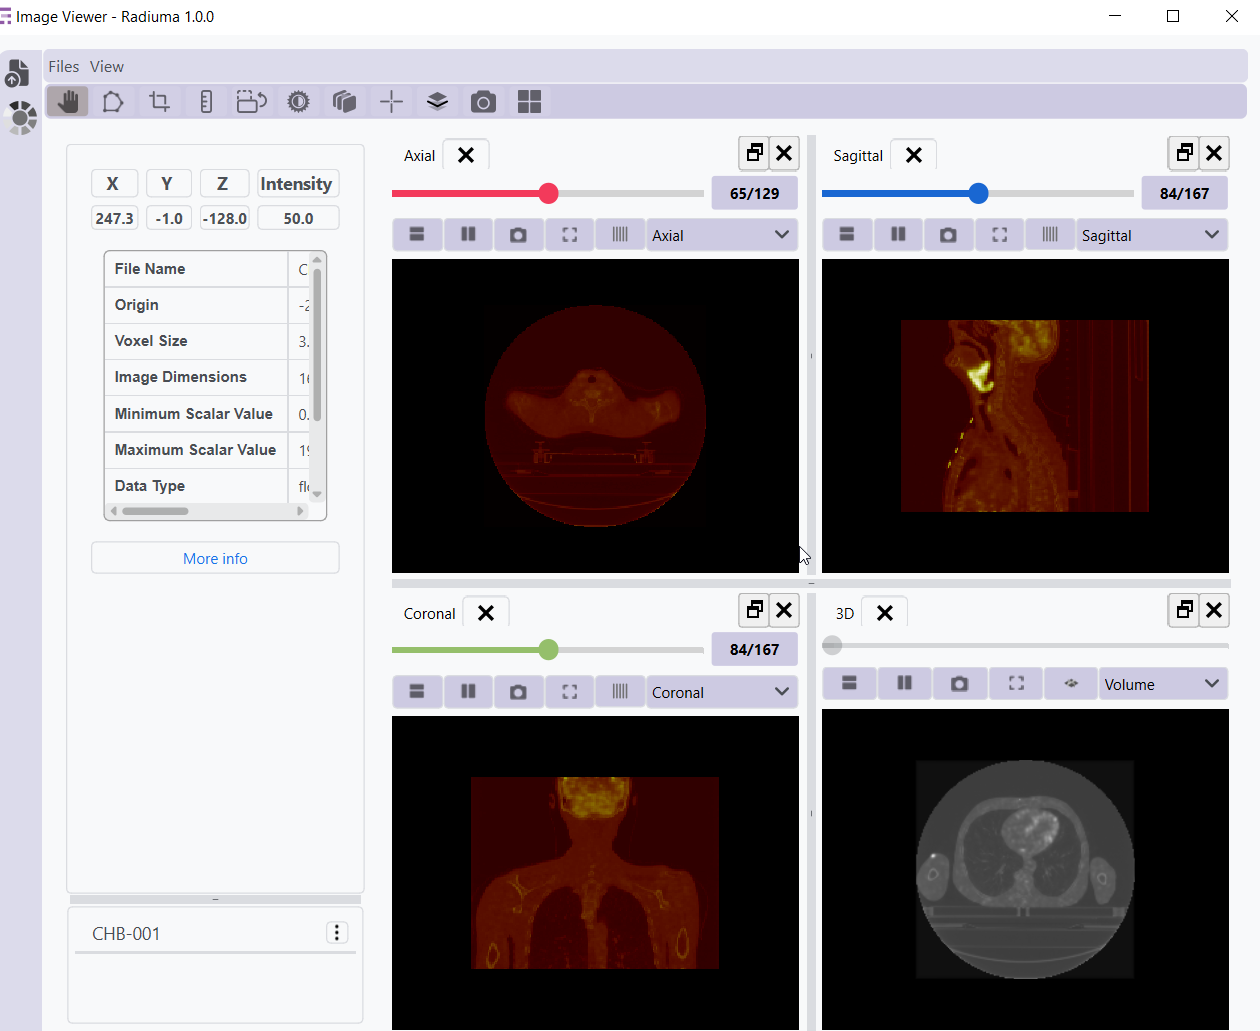
This is the PET image:
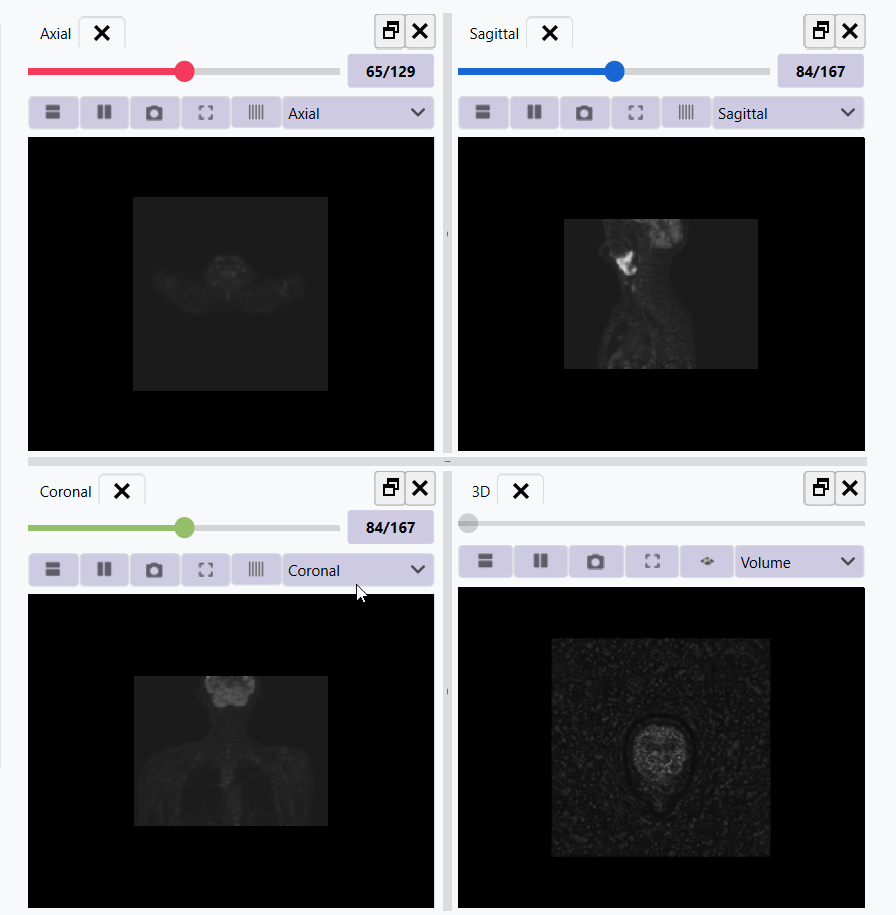
This is the CT image:
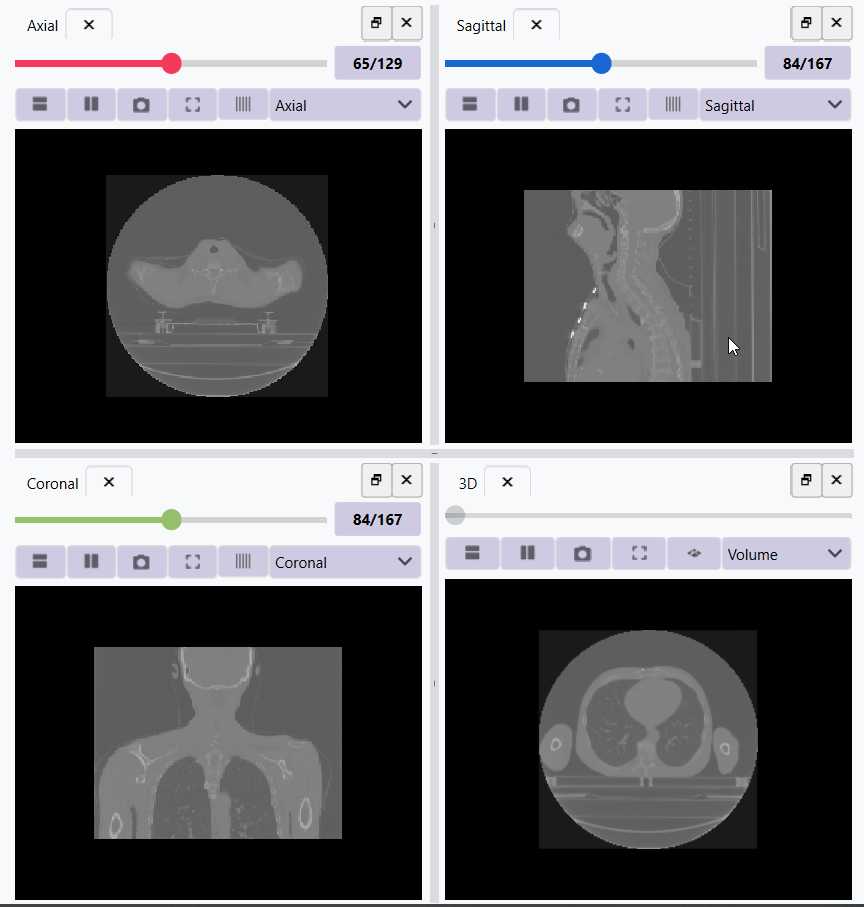
This is the fusion of the Registered PET and CT images:
PET/CT Registration and Filtering
This workflow combines registration and filtering techniques to enhance specific features in multimodal AutoPET data. The workflow first aligns PET images to CT images and then applies filters to enhance particular features of interest in the registered images.
How It Works
Image Reader Tool (CT): Load the CT image as the fixed (reference) image
Provides the anatomical reference frame
CT scans offer detailed structural information
Image Reader Tool (PET): Load the PET image as the moving image
Contains functional/metabolic information
Will be spatially aligned to match the CT reference frame
Image Registration Tool: Align the PET image to the CT reference
Uses either rigid or non-rigid registration depending on requirements
Ensures the metabolic activity is precisely localized to anatomical structures
Image Filter Tool: Apply selected filters to the registered PET image
Enhances specific features of interest
Reduces noise or highlights particular characteristics
Available filters include Gabor, Wavelet, Threshold, Gradient, and Smoothing
Writer Tool: Save the filtered registered image
Preserves the spatial alignment with anatomical structures
Enhanced features are ready for further analysis
Workflow Integration
To implement this PET/CT registration and filtering pipeline:
Example Workflow: Download the PET/CT Registration & Filtering workflow
Sample Data: Use CT and PET images from the Data folder
Add two Image Reader tools to your workflow: * One for the CT image * One for the PET image
Configure both Image Readers to load the appropriate data
Add an Image Registration tool and connect: * CT Image Reader output → “fix image” input * PET Image Reader output → “moving image” input
Configure registration parameters appropriate for PET/CT alignment: * For most applications, rigid registration is sufficient * For areas with tissue deformation, consider non-rigid registration
Add an Image Filter tool and connect: * Registration tool output → Filter input
Video Tutorial: Watch the step-by-step guide on YouTube: Medical Image Registration and Fusion | Multimodal Medical Imaging with Radiuma
Reading a DICOM Series
Medical images are often stored in the DICOM format, which can be easily imported into Radiuma for analysis:
Add Image Reader Tool - Double-click on the “Image Reader” tool in the left panel - A new node will appear in the workspace
Configure Tool - Double-click on the Image Reader node to open its configuration dialog - Select “Folder” as the Source Type - Click “Browse” and navigate to your DICOM directory - Click “OK” to confirm
Run the Tool - Click the “Run” button on the Image Reader node - The tool will process the DICOM files and make them available for other tools - Status information appears in the log panel at the bottom
Visualize the Image - Add an “Image Viewer” tool to the workspace - Connect the output port of the Image Reader to the input port of the Image Viewer - Run the Image Viewer tool to display the images - Use the viewer toolbox for panning, zooming, and adjusting window/level settings
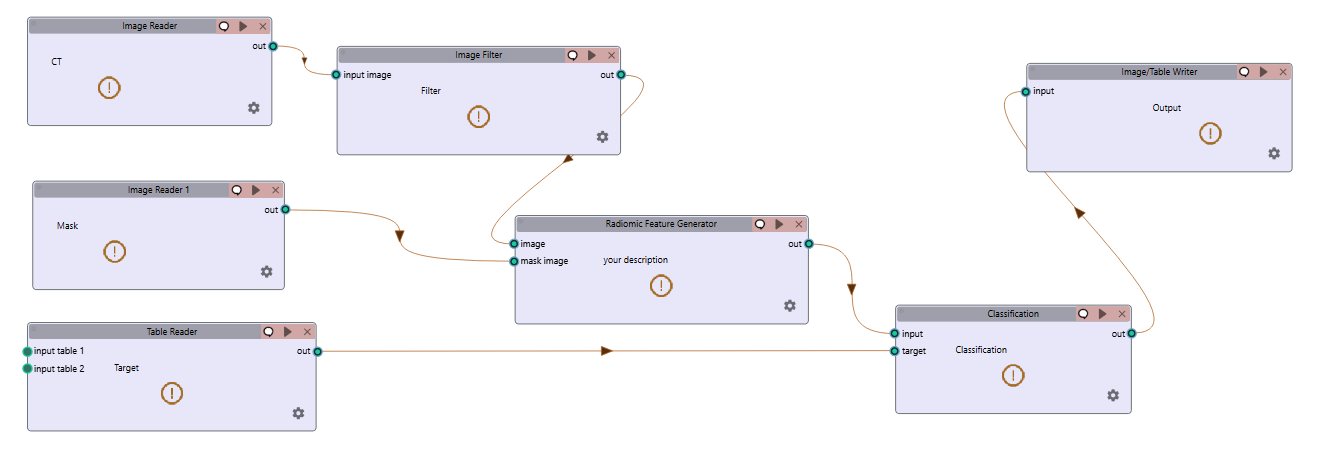
Radiomics and Classification
This workflow demonstrates how to extract radiomic features from medical images and use machine learning classification to analyze those features for diagnostic or prognostic purposes.
How It Works
Image Reader Tool: Load the medical image containing regions of interest
Configure the reader to load your source image (CT, MRI, PET, etc.)
This image provides the intensity values for feature extraction
Image Filter Tool: Apply preprocessing filters to enhance features of interest
Select appropriate filters based on the analysis goals
Enhance specific image characteristics that may correlate with clinical outcomes
Common options include Wavelet or LoG filters to highlight textural patterns
Radiomic Feature Generator: Extract quantitative features from the filtered image
Requires both the filtered image and a segmentation mask defining regions of interest
Calculates a comprehensive set of standardized radiomic features
Features can include first-order statistics, shape features, and texture metrics
Configure appropriate discretization parameters based on your imaging modality
Classification Tool: Apply machine learning to analyze radiomic features
Uses extracted features to train a classification model
Supports multiple algorithm options: * Logistic Regression: Linear model for probabilistic classification * Support Vector Machines: Effective for high-dimensional feature spaces * Random Forest: Ensemble method robust to overfitting * Neural Networks: Deep learning approach for complex relationships
Includes options for cross-validation and performance evaluation
Writer Tool: Save classification results and model performance metrics
Export classification results in tabular format (CSV, Excel)
Save performance metrics like accuracy, sensitivity, specificity, and AUC
Option to export the trained model for future predictions
Workflow Integration
To implement this radiomics and classification pipeline:
Example Workflow: Download the Radiomics & Classification workflow
Sample Data: Use sample images and masks from the Data folder
Note on Classification: For demonstration purposes, this example focuses on radiomic feature extraction. To perform actual classification with meaningful results, you’ll need to:
Use your own dataset with multiple samples and labeled outcomes
Ensure sufficient sample size for training and validation
Replace the sample data with your clinical dataset including images, masks, and corresponding labels
Add an Image Reader tool to your workflow * Configure it to load your medical image
Add an Image Filter tool and connect: * Image Reader output → Filter input * Configure appropriate filter parameters
Add a Radiomic Feature Generator tool and connect: * Filter tool output → “Image” input * Connect a segmentation mask to the “Mask” input * Configure feature extraction parameters
Add a Classification tool and connect: * Radiomic Feature Generator output → Classification input * Select your preferred classification algorithm * Configure training parameters and cross-validation options
Add a Writer tool and connect: * Classification tool output → Writer input * Configure to save results in your preferred format
Run the workflow to extract features, train the classifier, and save results
This workflow enables quantitative image analysis for applications such as tumor classification, treatment response prediction, and outcome prognostication based on imaging biomarkers.
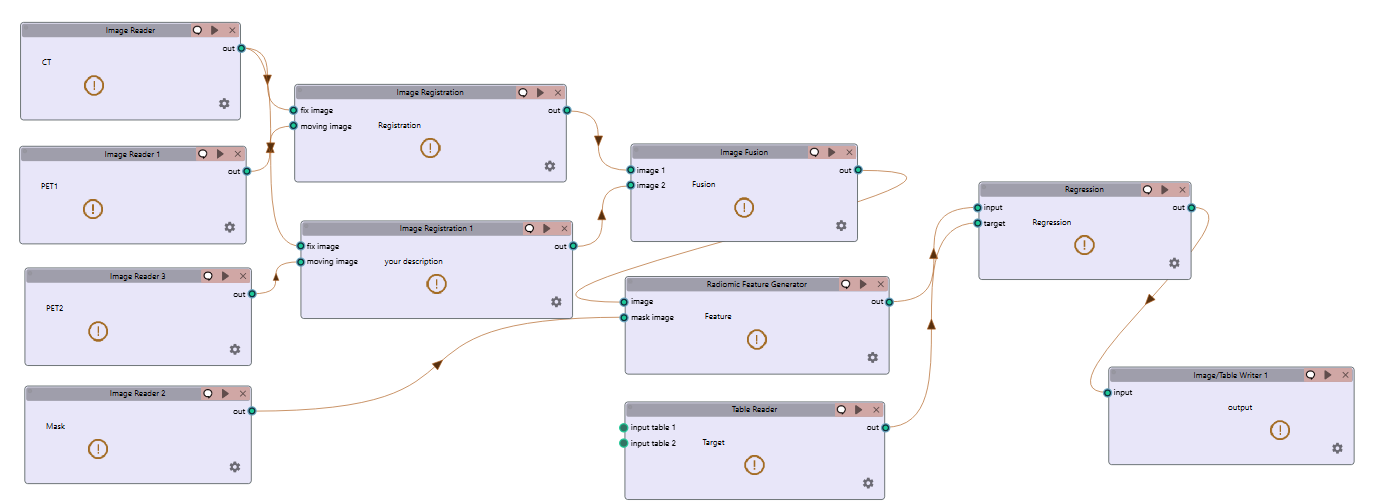
Multi-Registration Regression Analysis
This workflow demonstrates how to combine multiple registration steps, image fusion, and radiomics analysis for building regression models that can predict continuous outcomes from medical images.
How It Works
First Registration Step: Align a primary image with an anatomical reference
Requires two input images: fixed (reference) and first moving image
Creates spatial alignment between different imaging series or timepoints
Uses appropriate registration parameters for the specific imaging modalities
Second Registration Step: Align a secondary image with the same reference
Uses the same fixed reference image as the first registration
Aligns a second moving image (e.g., different modality or timepoint)
Ensures all images exist in the same spatial reference frame
Image Fusion Tool: Combine information from both registered images
Fuses the two registered images into a single comprehensive visualization
Preserves complementary information from each registered image
Creates a multiparametric representation of the anatomy or pathology
Radiomic Feature Generator: Extract quantitative features from the fused image
Calculates standardized features from the fused image
Uses appropriate segmentation mask to define regions of interest
Extracts features that capture the combined information from both modalities
Regression Tool: Build predictive models for continuous outcomes
Uses radiomic features as input variables
Supports multiple regression algorithms: * Linear Regression: For linear relationships * Ridge/Lasso Regression: For models with regularization * Support Vector Regression: For non-linear relationships * Random Forest Regression: For complex feature interactions
Includes options for model validation and performance metrics
Writer Tool: Save regression results and model performance
Export prediction results and calculated features
Save performance metrics like R-squared, MAE, and RMSE
Option to export the trained model for future predictions
Workflow Integration
To implement this multi-registration regression pipeline:
Example Workflow: Download the Multi-Registration Regression workflow
Sample Data: Use CT, PET, and mask data from the Data folder
Add three Image Reader tools to your workflow: * One for the fixed reference image * One for the first moving image * One for the second moving image
Add the first Image Registration tool and connect: * Fixed reference image → “fix image” input * First moving image → “moving image” input * Configure appropriate registration parameters
Add the second Image Registration tool and connect: * Same fixed reference image → “fix image” input * Second moving image → “moving image” input * Configure appropriate registration parameters
Add an Image Fusion tool and connect: * First registration output → “Image 1” input * Second registration output → “Image 2” input * Configure fusion parameters appropriate for your analysis
Add a Radiomic Feature Generator tool and connect: * Fusion tool output → “Image” input * Connect a segmentation mask to the “Mask” input * Configure feature extraction parameters
Add a Regression tool and connect: * Radiomic Feature Generator output → Regression input * Select your preferred regression algorithm * Configure model parameters and validation options
Add a Writer tool and connect: * Regression tool output → Writer input * Configure to save results in your preferred format
Run the workflow to perform registrations, fusion, feature extraction, and regression modeling
This advanced workflow enables quantitative prediction of continuous outcomes such as survival time, treatment response measurements, or physiological parameters based on multimodal imaging biomarkers.
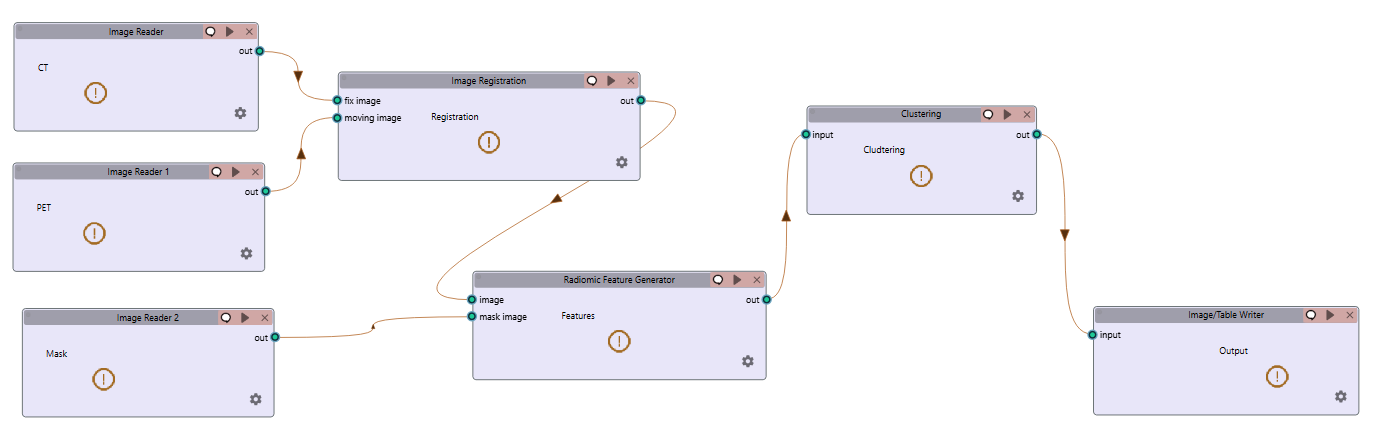
Radiomics-Based Clustering
This workflow demonstrates how to use unsupervised clustering techniques to discover natural groupings within radiomic features extracted from medical images.
How It Works
Image Registration Tool: Align images for consistent spatial reference
Register images from different timepoints or modalities
Ensures all subsequent analysis occurs in the same spatial reference frame
Use appropriate registration parameters for your specific imaging modalities
Radiomic Feature Generator: Extract quantitative features from registered images
Calculates a comprehensive set of standardized radiomic features
Features typically include intensity statistics, shape metrics, and texture patterns
Uses appropriate segmentation mask to define regions of interest
Configure parameters based on your specific imaging modality
Clustering Tool: Apply unsupervised learning to discover patterns
Uses radiomic features as input variables
Supports multiple clustering algorithms: * K-Means: Partitions observations into k clusters with nearest mean * Agglomerative Clustering: Hierarchical approach building nested clusters * K-Mode Clustering: Specialized for categorical data * Gaussian Mixture Model: Probabilistic model for distribution mixtures
Includes options for determining optimal cluster numbers and visualization
Writer Tool: Save clustering results and visualizations
Export cluster assignments and feature data
Save cluster visualization plots and statistics
Generate reports on cluster characteristics and distributions
Workflow Integration
To implement this radiomics-based clustering pipeline:
Example Workflow: Download the Registration & Clustering workflow
Sample Data: Use CT, PET, and mask data from the Data folder
Add an Image Registration tool to your workflow * Configure the tool with appropriate fixed and moving images * Set registration parameters based on your specific application
Add a Radiomic Feature Generator tool and connect: * Registration tool output → “Image” input * Connect a segmentation mask to the “Mask” input * Configure feature extraction parameters appropriate for your analysis
Add a Clustering tool and connect: * Radiomic Feature Generator output → Clustering input * Select your preferred clustering algorithm * Configure algorithm parameters and evaluation metrics
Add a Writer tool and connect: * Clustering tool output → Writer input * Configure to save results in your preferred format
Run the workflow to perform registration, feature extraction, clustering analysis, and save results
This workflow is valuable for discovering natural subgroups within imaging data, potentially identifying previously unknown disease subtypes, patient stratification groups, or distinct tissue characteristics that may have clinical significance.